
Yue Xu, Liming Nie. Application of Optical Imaging for Studying Chinese Acupuncture: a Review[J]. Chinese Journal of Lasers, 2023, 50(3): 0307105
- Chinese Journal of Lasers
- Vol. 50, Issue 3, 0307105 (2023)
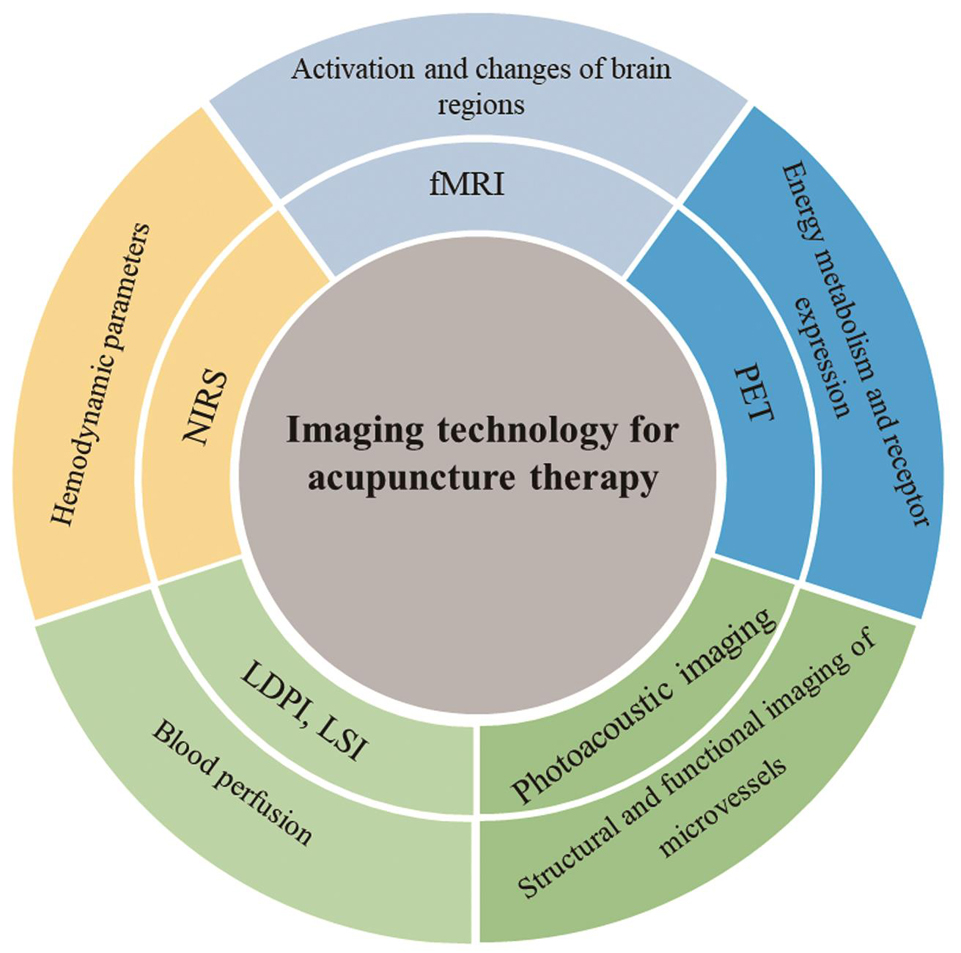
Fig. 1. Different imaging technologies for studying acupuncture therapy and their application scope
![Continuous display of gastric laser Doppler blood perfusion images of rats during electroacupuncture (EA)[30]. (a) Before EA stimulation; (b) instant of EA stimulation; (c) EA stimulation for 5 min; (d) EA stimulation for 10 min; (e) 5 min after ceasing EA stimulation; (f) 10 min after ceasing EA stimulation](/richHtml/zgjg/2023/50/3/0307105/img_02.jpg)
Fig. 2. Continuous display of gastric laser Doppler blood perfusion images of rats during electroacupuncture (EA)[30]. (a) Before EA stimulation; (b) instant of EA stimulation; (c) EA stimulation for 5 min; (d) EA stimulation for 10 min; (e) 5 min after ceasing EA stimulation; (f) 10 min after ceasing EA stimulation
Fig. 3. Comparison of peak values of group average hemodynamic response between CG and IG for each phase[59]. (a) The first phase (0 week); (b) the second phase (4 weeks); (c) the third phase (8 weeks)
Fig. 4. Maximum amplitude projection (MAP) and corresponding computed vascular centerlines overlaid with segmented volumetric opticalresolution photoacoustic microscopy (OR-PAM) images of GB34, ST36 and non-acupoint sites in the osteoarthritis group (scale bar is 200 μm)[73]
Fig. 5. PAT images of brain under acupuncture on the left or right GB34 point for a representative normal mouse, where the images are given at different time points and the color scale indicates relative strength of photoacoustic signal[77]
|
Table 1. Technical parameters and characteristics of different optical imaging methods and their application scope

Set citation alerts for the article
Please enter your email address
© Copyright 2018-2021 | Chinese Laser Press. All Rights Reserved 沪ICP备15018463号-20