
Ying-Han Li, Zhu An, Jing-Jun Zhu, Ling Li. Characteristic X-ray yields and cross sections of thick targets of Al, Ti, Zr, W and Au induced by keV-electron impact [J]. Acta Physica Sinica, 2020, 69(13): 133401-1
- Acta Physica Sinica
- Vol. 69, Issue 13, 133401-1 (2020)
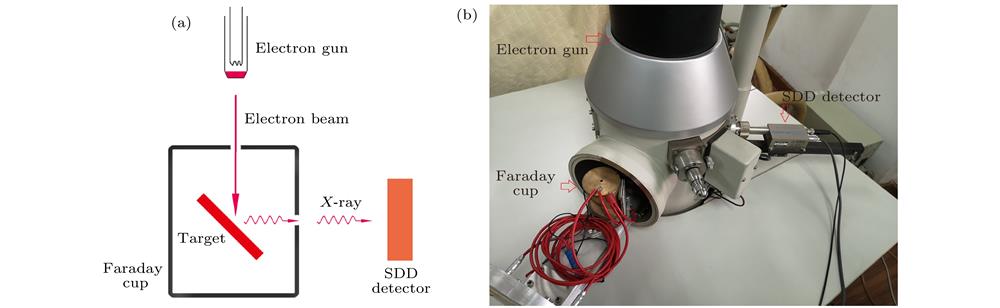
Fig. 1. (a)The schematic of experimental setup; (b) photograph of experimental setup.
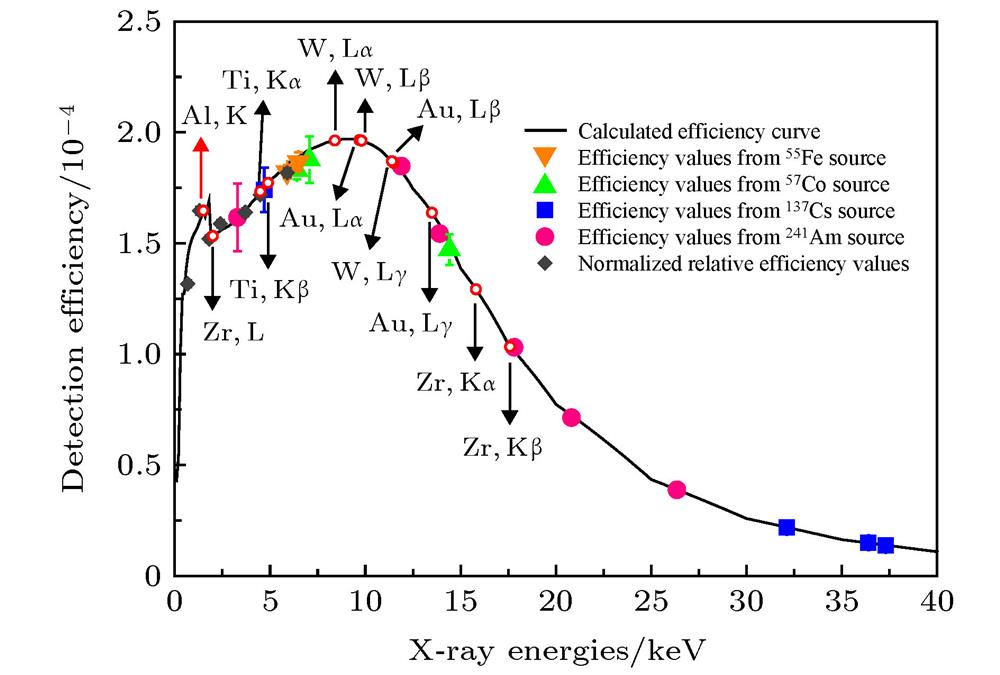
Fig. 2. The X-ray detection efficiency of the SSD detector. The positions of the characteristic X-ray lines for Al, Ti, Zr, W and Au are indicated by the open circles. The solid line represents the theoretical values calculated based on the detector’s parameters.
Fig. 3. The experimental spectrum (solid line) and the bremsstrahlung background spectrum simulated by PENELOPE (dashed line) produced by 27 keV electron impact on thick W target.
Fig. 4. The geometry used in the PENELOPE simulations.
Fig. 5. [in Chinese]
Fig. 5. Solid circles denote the experimental characteristic X-ray yields of thick targets at different incident electron energies. Solid curves represent the results of Monte Carlo simulations using the PENELOPE code. Dashed curves are the scaled results of Monte Carlo simulations by scaling factors that are given in parentheses. The insets show the schematic of experimental geometry.
Fig. 5. [in Chinese]
Fig. 6. In the case of α = 45°, β = 45°, the solid dots represent the total characteristic X-ray yields calculated by PENELOPE, which include the contributions from the primary electron ionization (hollow circles), secondary electron ionization(hollow triangles) and bremsstrahlung photon ionization (hollow squares). The solid lines are the characteristic X-ray yields calculated by Eq. (2 ). The insets show the schematic of calculation geometry.
Fig. 6. [in Chinese]
Fig. 6. [in Chinese]
Fig. 7. In the case of α = 45°, β = 45°, the solid dots represent the total characteristic X-ray yields calculated by PENELOPE, which include the contributions from the primary electron ionization (hollow circles), secondary electron ionization(hollow triangles) and bremsstrahlung photon ionization (hollow squares). The solid lines are the characteristic X-ray yields calculated by Eq. (2 ). The insets show the schematic of calculation geometry.
Fig. 7. [in Chinese]
Fig. 7. [in Chinese]
Fig. 8. Experimental K-shell ionization cross sections of (a) Al, (b) Ti, (c) Zr (solid lines) and the DWBA theoretical values (dashed lines). The scaling factors are given in parentheses.
Fig. 9. Experimental L-shell characteristic X-ray production cross sections of (a) Zr, (b)−(d) W, (e)−(g) Au (solid lines) and the DWBA theoretical values (dashed lines). The scaling factors are given in parentheses.

Set citation alerts for the article
Please enter your email address
© Copyright 2018-2021 | Chinese Laser Press. All Rights Reserved 沪ICP备15018463号-20