
Hehe Dong, Shikai Wang, Zhongyue Wang, Chunlei Yu, Chongyun Shao, Wei Wei, Lili Hu. Spectral Performance of Yb 3+-Doped Silica Fiber for 1018 nm Tandem-Pumping Technology[J]. Chinese Journal of Lasers, 2021, 48(11): 1103001
- Chinese Journal of Lasers
- Vol. 48, Issue 11, 1103001 (2021)
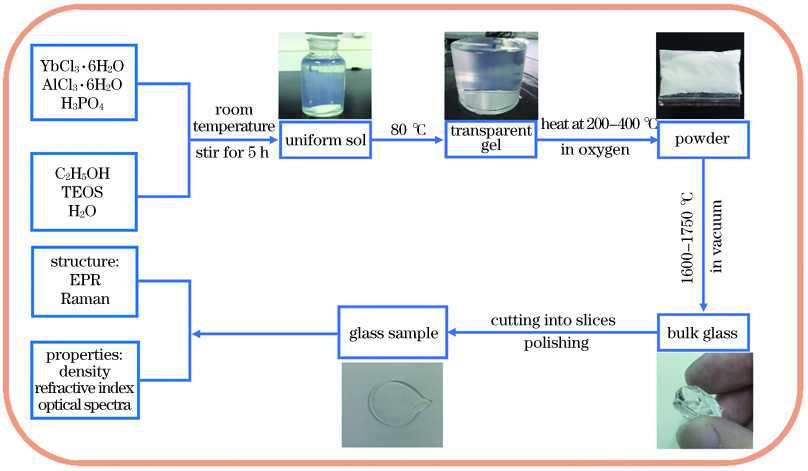
Fig. 1. Preparation process of Yb3+-doped silica glass samples
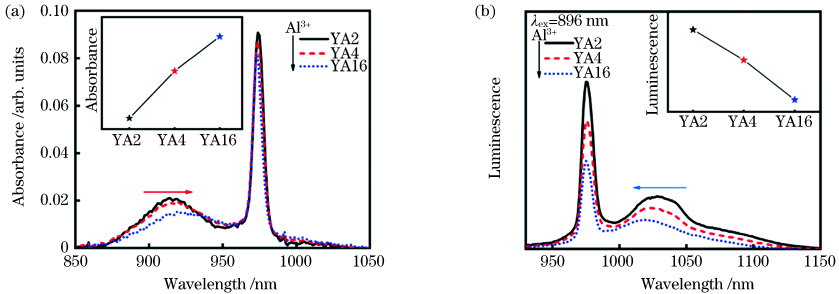
Fig. 2. Absorption and fluorescence spectra of YA series samples, the insets are absorption and fluorescence intensities at 1018 nm, respectively. (a) Absorption spectra; (b) fluorescence spectra
Fig. 3. Absorption and fluorescence spectra of YAP series samples, the insets are absorption and fluorescence intensities at 1018 nm, respectively. (a) Absorption spectra; (b) fluorescence spectra
Fig. 4. Absorption and fluorescence spectra of YP series samples, the insets are absorption and fluorescence intensities at 1018 nm, respectively. (a) Absorption spectra; (b) fluorescence spectra
Fig. 5. Absorption and fluorescence spectral lines of YA2 glass sample (after Lorentz fitting). (a) Absorption spectral line; (b) fluorescence spectral line
Fig. 6. Normalized spectral intensity of three series of optimal samples at 1018 nm. (a) Absorption spectra; (b) fluorescence spectra
Fig. 7. Raman spectra of YA and YP series samples. (a) YA series samples; (b) YP series samples
Fig. 8. 2D-HYSCORE spectra of YA2 and YP8 samples. (a) YA2 sample; (b) YP8 sample
| |||||||||||||||||||||||||||||||||||||||||||||||||||||||||||||||||||||
Table 1. Mean composition of three series of Yb3+-doped silica glass samples
| |||||||||||||||||||||||||||||||||||||||||||||||||||||||||||||||||||||||||||||||||||||||||||||||||||||||||||||||
Table 2. Yb3+ Stark transition energies, scalar crystal-field parameters NJ and asymmetry degree α in different series of glass samples
|
Table 3. Raman peak position in the quartz glass matrix

Set citation alerts for the article
Please enter your email address
© Copyright 2018-2021 | Chinese Laser Press. All Rights Reserved 沪ICP备15018463号-20