
Junyang LIU, Shengjun ZHU. Proximity between markets and the geographical agglomeration of exporters in Guangdong province [J]. Geographical Research, 2020, 39(9): 2044
- Geographical Research
- Vol. 39, Issue 9, 2044 (2020)
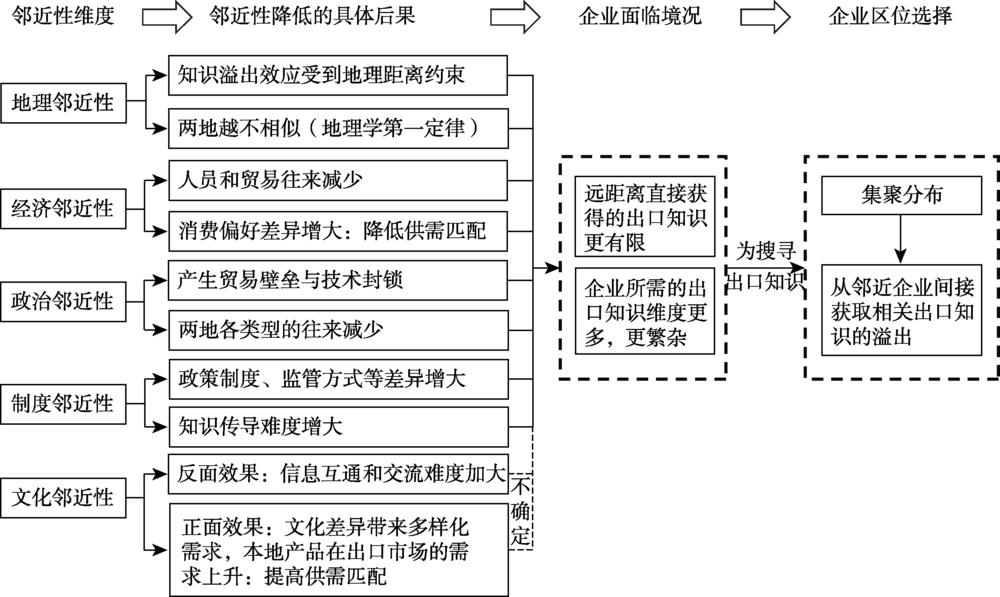
Fig. 1. The proximity between markets and firm agglomeration
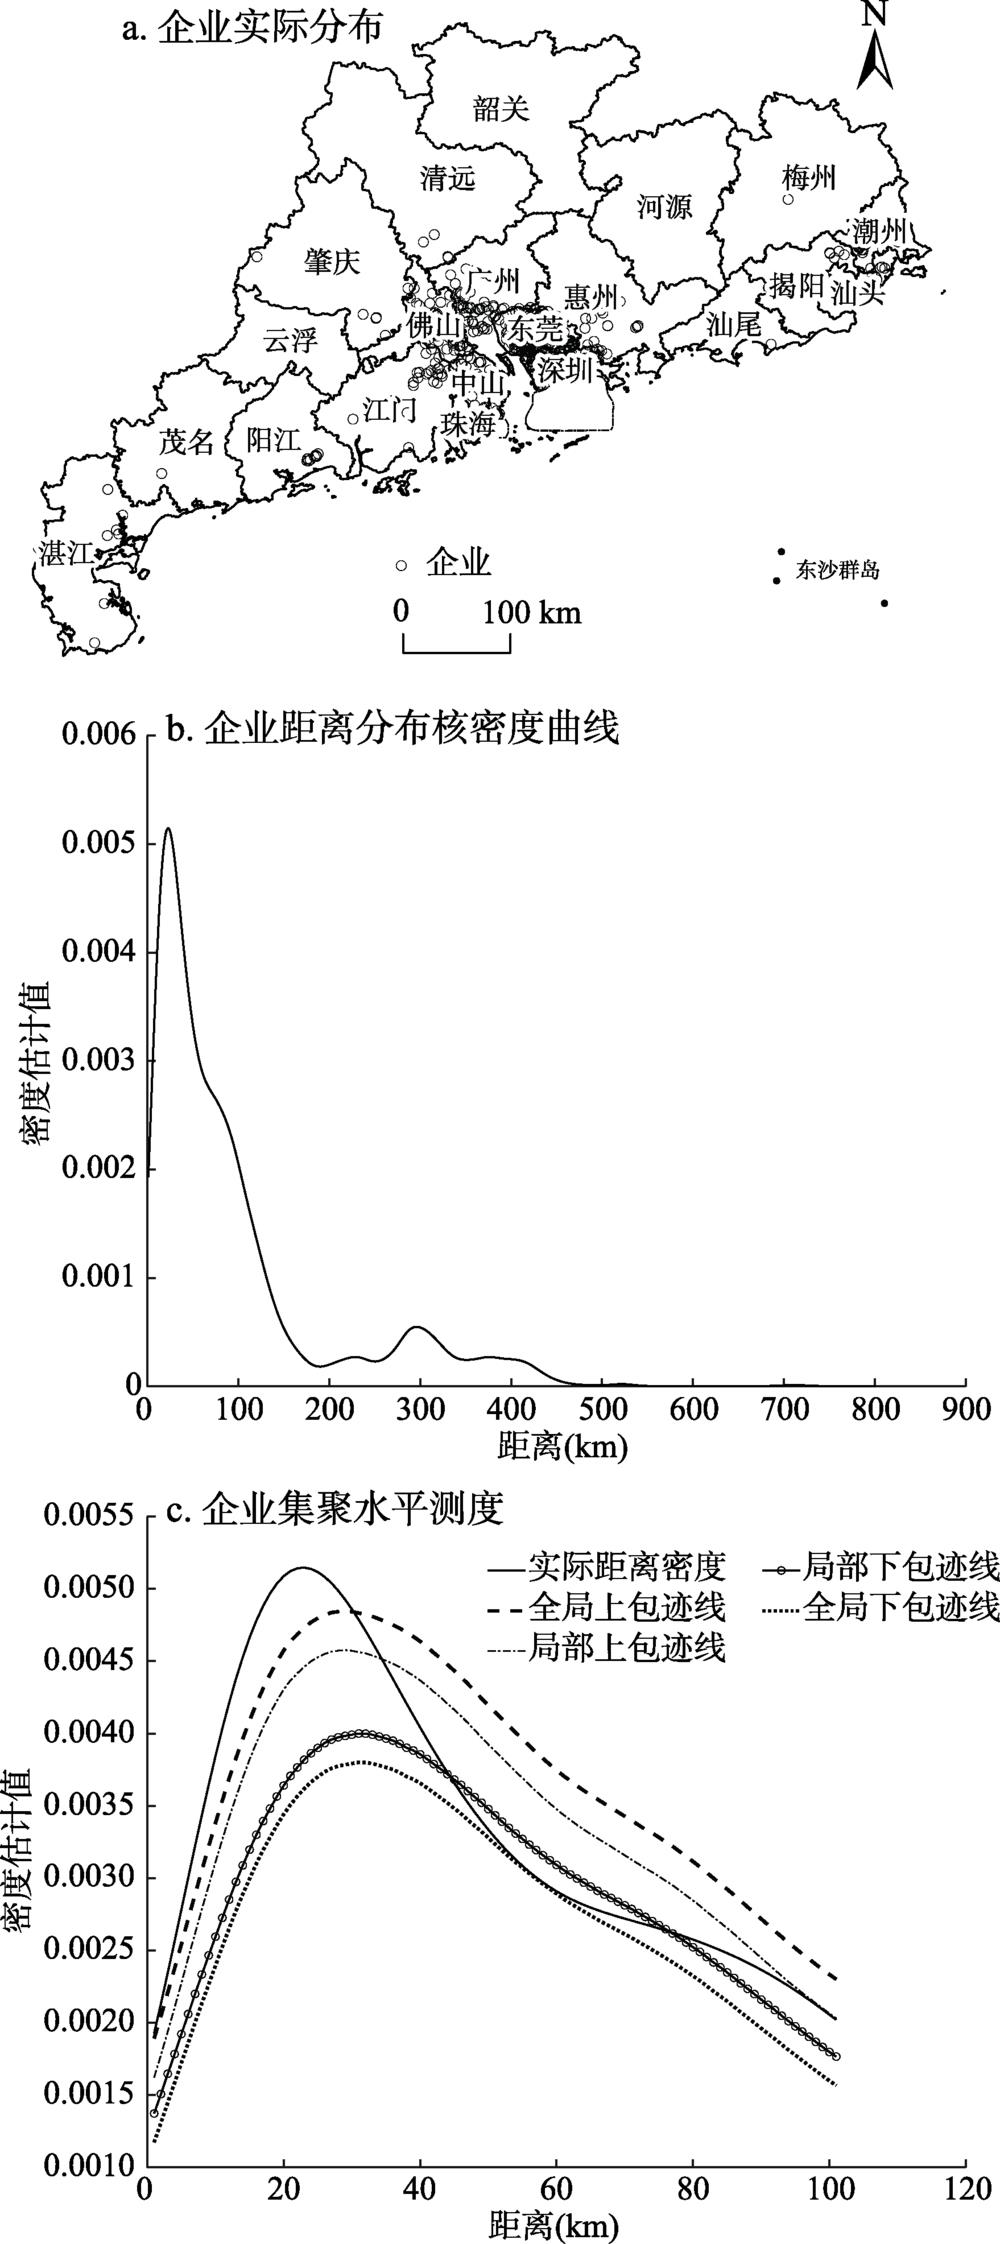
Fig. 2. The spatial distribution of Guangdong’s firms which exported to Norway in 2016
Fig. 3. The export trade flows of exporters in Guangdong province (2016) and the cumulative amounts of exporters to each country/region(2000—2016)
Fig. 4. The annual change of Guangdong’s export value and the proportion of each continent
Fig. 5. The value of Guangdong’s exports to other countries/ regions
Fig. 6. The point density distribution of Guangdong’s exporters
Fig. 7. LISA clusters of Guangdong’s exporters
Fig. 8. The annual change of Shenzhen and Zhuhai’s export value as well as their ratio
Fig. 9. The kernel density curve of Guangdong’s exporters (0~800 km)
Fig. 10. The kernel density curve of Guangdong’s exporters which exported to Mexico, Belarus and the Philippines in 2016
Fig. 11. The correlation of localization index and export value of Guangdong’s exporters
| ||||||||||||||||||||||||||||||||||||||||
Table 1. Variable description and the expected results
| ||||||||||||||||||||||||||||||||||||||||||||||||||||||||||||||||||||||||||||||||||||||||||||||||||||||||||||||||||||||||||||||||||||||||||||||||||||||||||||||||||
Table 2. The relationship between market proximity and localization index of firms


Set citation alerts for the article
Please enter your email address

© Copyright 2018-2021 | Chinese Laser Press. All Rights Reserved 沪ICP备15018463号-20