
Yan Han, Yang Yuanhong, Yang Fuling. Response Model and Compensation Technology of Thermal Diffusion Delay in Fiber Optic Gyro Coil[J]. Chinese Journal of Lasers, 2019, 46(1): 106003
- Chinese Journal of Lasers
- Vol. 46, Issue 1, 106003 (2019)
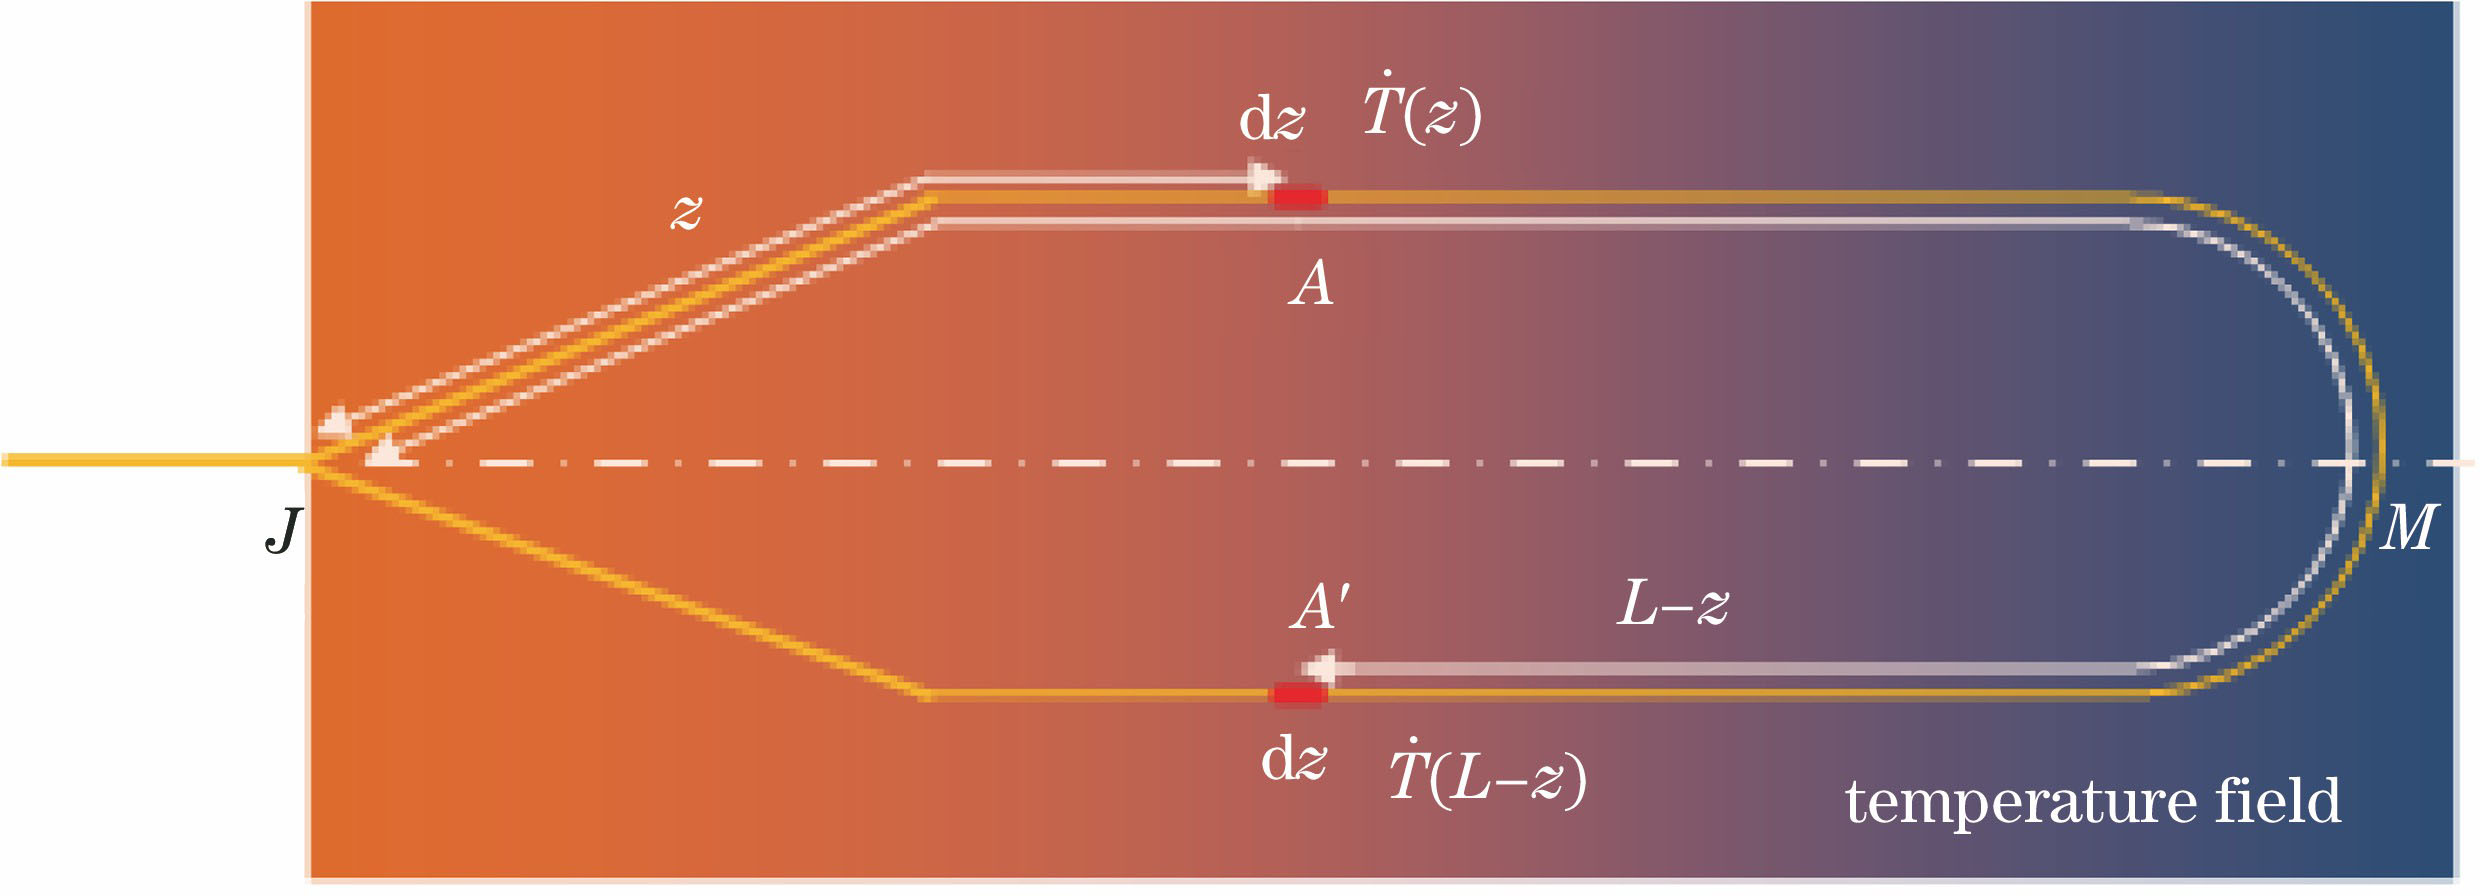
Fig. 1. Schematic of fiber coil expansion
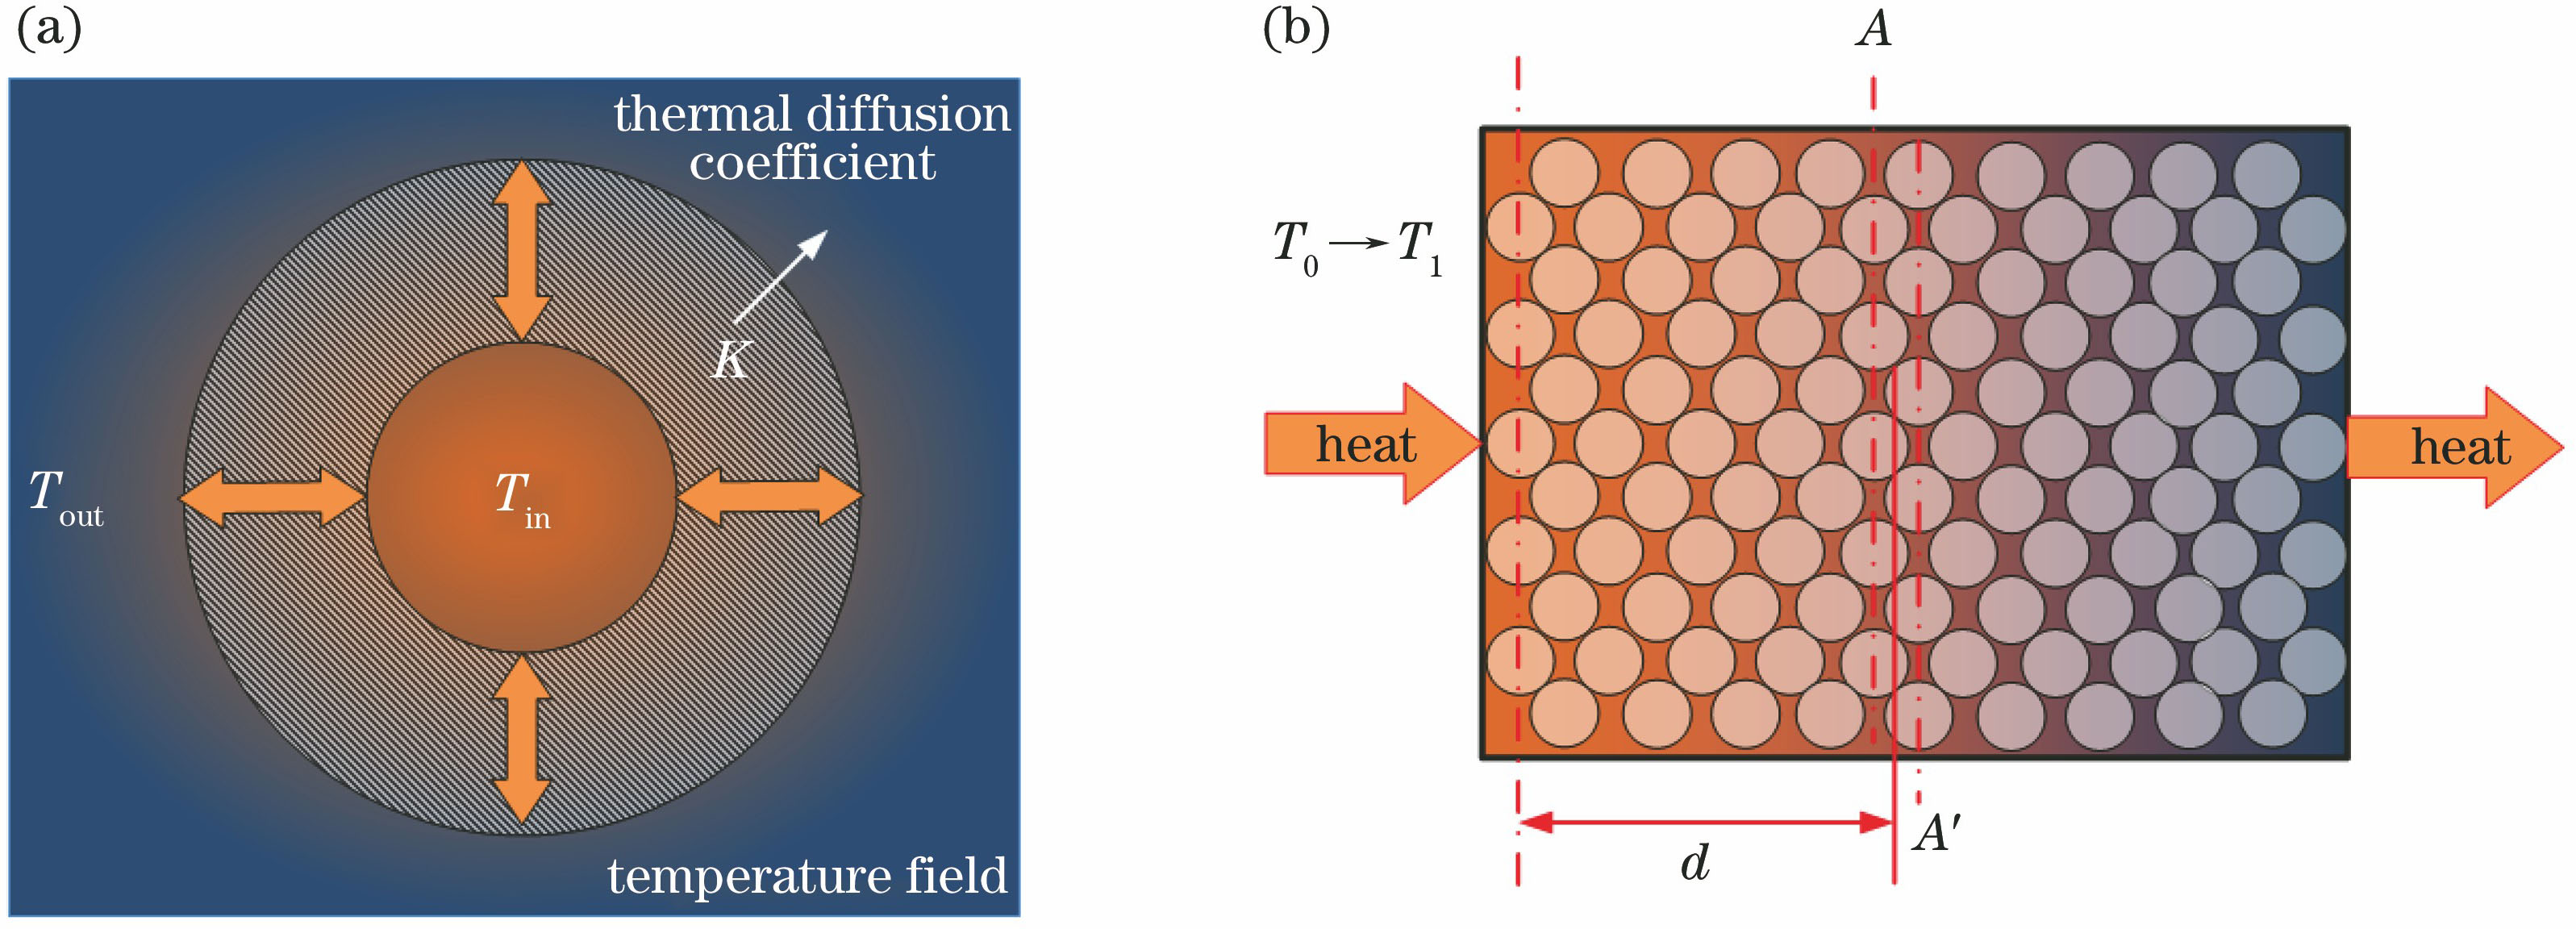
Fig. 2. Temperature distribution of fiber coil. (a) Overall distribution; (b) equivalent semi-infinite thermal diffusion model
Fig. 3. Schematic of temperature change at position d in fiber coil under different diffusion coefficients
Fig. 4. Structural diagram of experimental system
Fig. 5. Experimental photos. (a) System photo; (b) installation photo of turntable with temperature chamber
Fig. 6. Output diagrams of FOG for -25 ℃→-45 ℃→-25 ℃
Fig. 7. Original zero bias and compensated zero bias of gyro for -25 ℃→-45 ℃→-25 ℃
Fig. 8. Relationship between thermal diffusion delay response time and temperature
Fig. 9. Gyroscope output in full-temperature
Fig. 10. Original gyro output and compensated gyro output in full temperature
|
Table 1. Parameter values of no-delay model
|
Table 2. Parameter values of delay model
|
Table 3. Zero biases of gyro before and after compensation

Set citation alerts for the article
Please enter your email address
© Copyright 2018-2021 | Chinese Laser Press. All Rights Reserved 沪ICP备15018463号-20