• Chinese Journal of Lasers
  • Vol. 46, Issue 6, 0614002 (2019)
Yan Peng, Chenjun Shi, Yiming Zhu**, and Songlin Zhuang*
Author Affiliations
  • Terahertz Technology Innovation Research Institute, Terahertz Spectrum and Imaging Technology Cooperative Innovation Center, Shanghai Key Lab of Modern Optical System, University of Shanghai for Science and Technology, Shanghai 200093, China
  • show less
    DOI: 10.3788/CJL201946.0614002 Cite this Article Set citation alerts
    Yan Peng, Chenjun Shi, Yiming Zhu, Songlin Zhuang. Qualitative and Quantitative Analysis Algorithms Based on Terahertz Spectroscopy for Biomedical Detection[J]. Chinese Journal of Lasers, 2019, 46(6): 0614002 Copy Citation Text show less
    Spectra of four pure samples of L-Glu, D-MI, CMH, and GABA
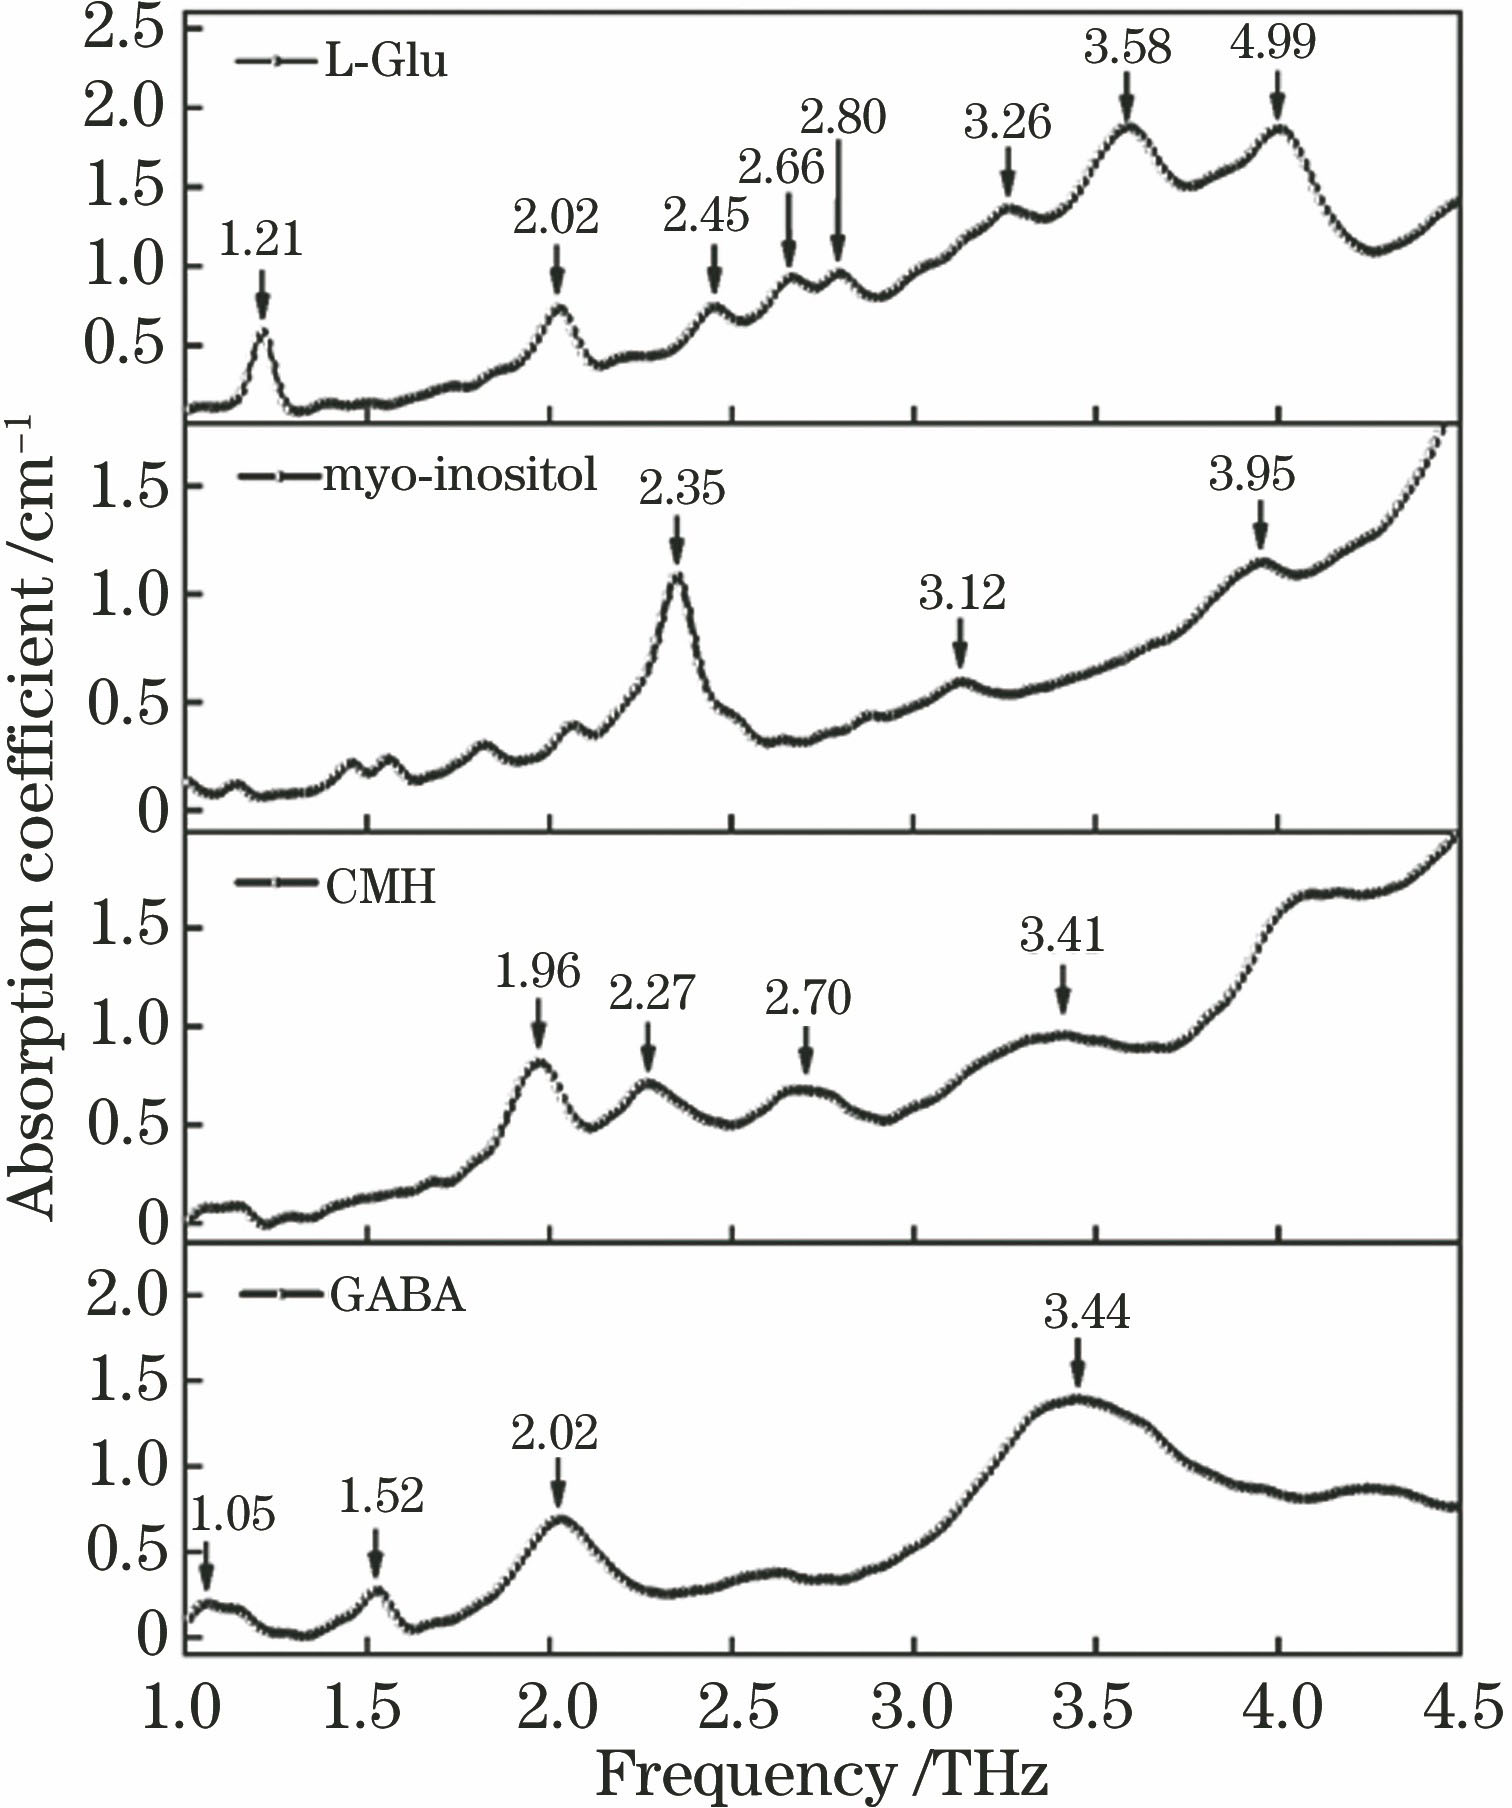
    Fig. 1. Spectra of four pure samples of L-Glu, D-MI, CMH, and GABA
    Measured spectra and calculated spectra. (a) Mixture sample of L-Glu, D-MI, and CMH; (b) mixture sample of all four components
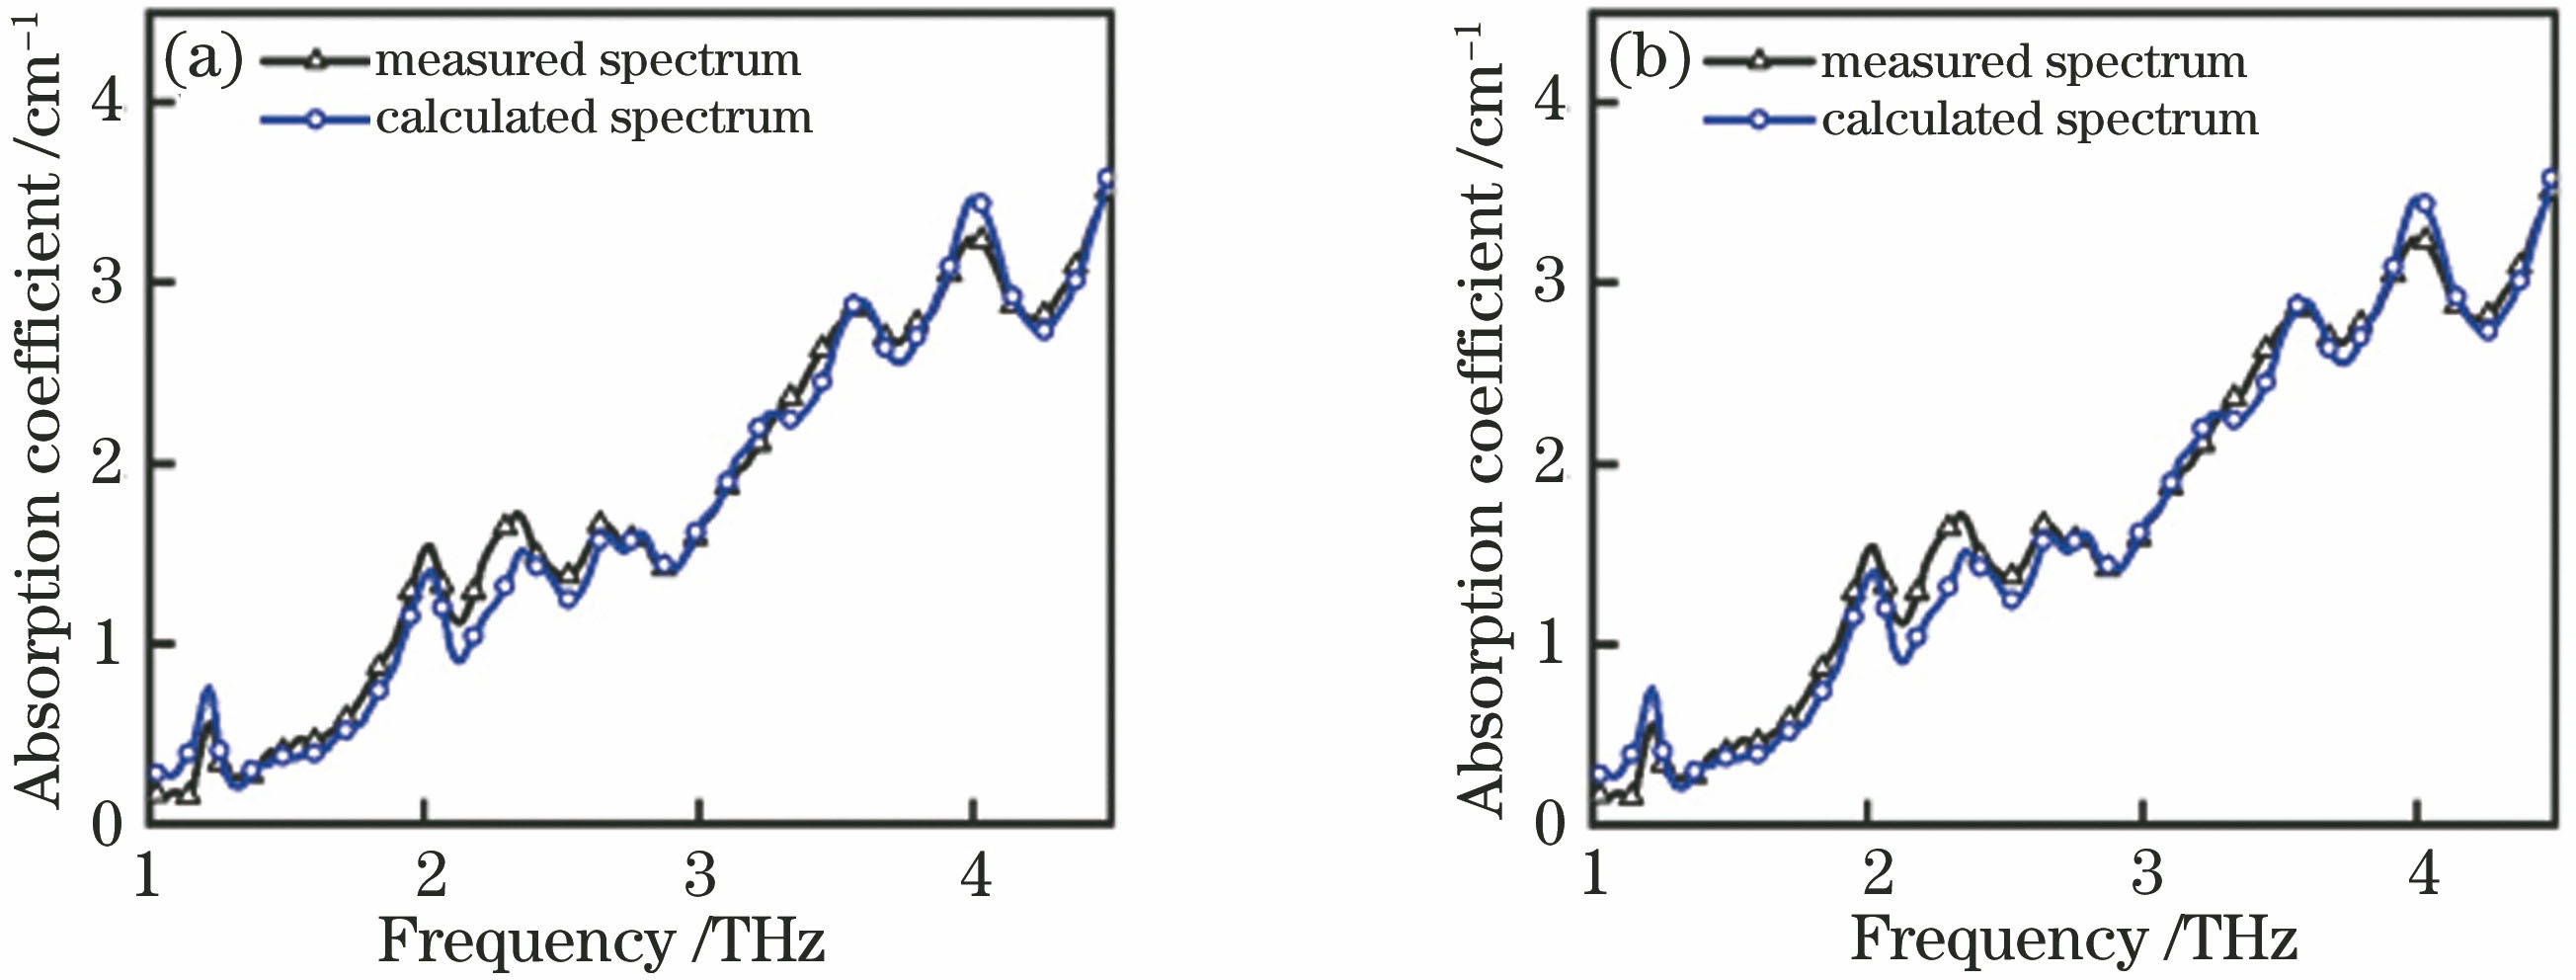
    Fig. 2. Measured spectra and calculated spectra. (a) Mixture sample of L-Glu, D-MI, and CMH; (b) mixture sample of all four components
    Spectra of 10 mixture samples. (a) Before wavelet transform; (b) after wavelet transform
    Fig. 3. Spectra of 10 mixture samples. (a) Before wavelet transform; (b) after wavelet transform
    RMSE of three SVR parameters based on leave-one-out cross validation. (a) Parameter c when g=0.01and e=0.01; (b) parameter g when c=0.25 and e=0.01; (c) parameter e when c=0.25 and g=0.01
    Fig. 4. RMSE of three SVR parameters based on leave-one-out cross validation. (a) Parameter c when g=0.01and e=0.01; (b) parameter g when c=0.25 and e=0.01; (c) parameter e when c=0.25 and g=0.01
    Actual and predicted concentrations of 10 mixture samples. (a) NAA; (b) NE
    Fig. 5. Actual and predicted concentrations of 10 mixture samples. (a) NAA; (b) NE
    ComponentActual concentrationna1 /%Calculated concentrationnc1 /%Root mean squarederror ERMS1Average root meansquared error E-RMS1 /%
    L-Glu4.654.650
    D-MI4.654.550.02154.65
    CMH4.654.100.1180
    Table 1. Concentration results of mixture sample of L-Glu, D-MI and CMH
    ComponentActual concentrationna2 /%Calculated concentrationnc2 /%Root mean squarederror ERMS2Average root meansquared error E-RMS2 /%
    L-Glu4.904.500.0816
    D-MI4.904.9005.44
    CMH4.904.600.0612
    GABA4.904.800.0204
    Table 2. Concentration results of mixture sample of all four components
    SamplenumberNAA massm1 /mgNE massm2 /mgMass of otherfive componentsm3 /mg
    13.021.13-
    29.857.02-
    311.9915.08-
    49.203.82-
    51.209.98-
    64.138.91-
    715.2012.03-
    812.873.19-
    94.864.80-
    107.0213.03-
    Table 3. Parameters of mixture samples including NAA and NE
    ComponentRMSE ERMSAverage RMSE E-RMSCorrelationcoefficient RAverage correlationcoefficient R-
    NAA0.00400.9913
    NE0.00400.00400.99140.99135
    Table 4. RMSE and correlation coefficient between predicted and actual concentrations of NAA and NE in mixture
    Number ofsamplesRMSE ERMSnCorrelationcoefficient Rn
    60.01250.9026
    80.00550.9853
    100.00400.9914
    Table 5. Accuracy of algorithm models under different sample numbers
    AlgorithmRMSE ERMSaCorrelationcoefficient Ra
    Partial least squares0.02310.8052
    BP nerve network0.01750.8353
    Support vector regression0.00400.9914
    Table 6. Prediction accuracy of different algorithms
    Yan Peng, Chenjun Shi, Yiming Zhu, Songlin Zhuang. Qualitative and Quantitative Analysis Algorithms Based on Terahertz Spectroscopy for Biomedical Detection[J]. Chinese Journal of Lasers, 2019, 46(6): 0614002
    Download Citation