
Jingui Ma, Peng Yuan, Jing Wang, Guoqiang Xie, Heyuan Zhu, Liejia Qian, "Single-shot cross-correlator for pulse-contrast characterization of high peak-power lasers," High Power Laser Sci. Eng. 6, 04000e61 (2018)
- High Power Laser Science and Engineering
- Vol. 6, Issue 4, 04000e61 (2018)
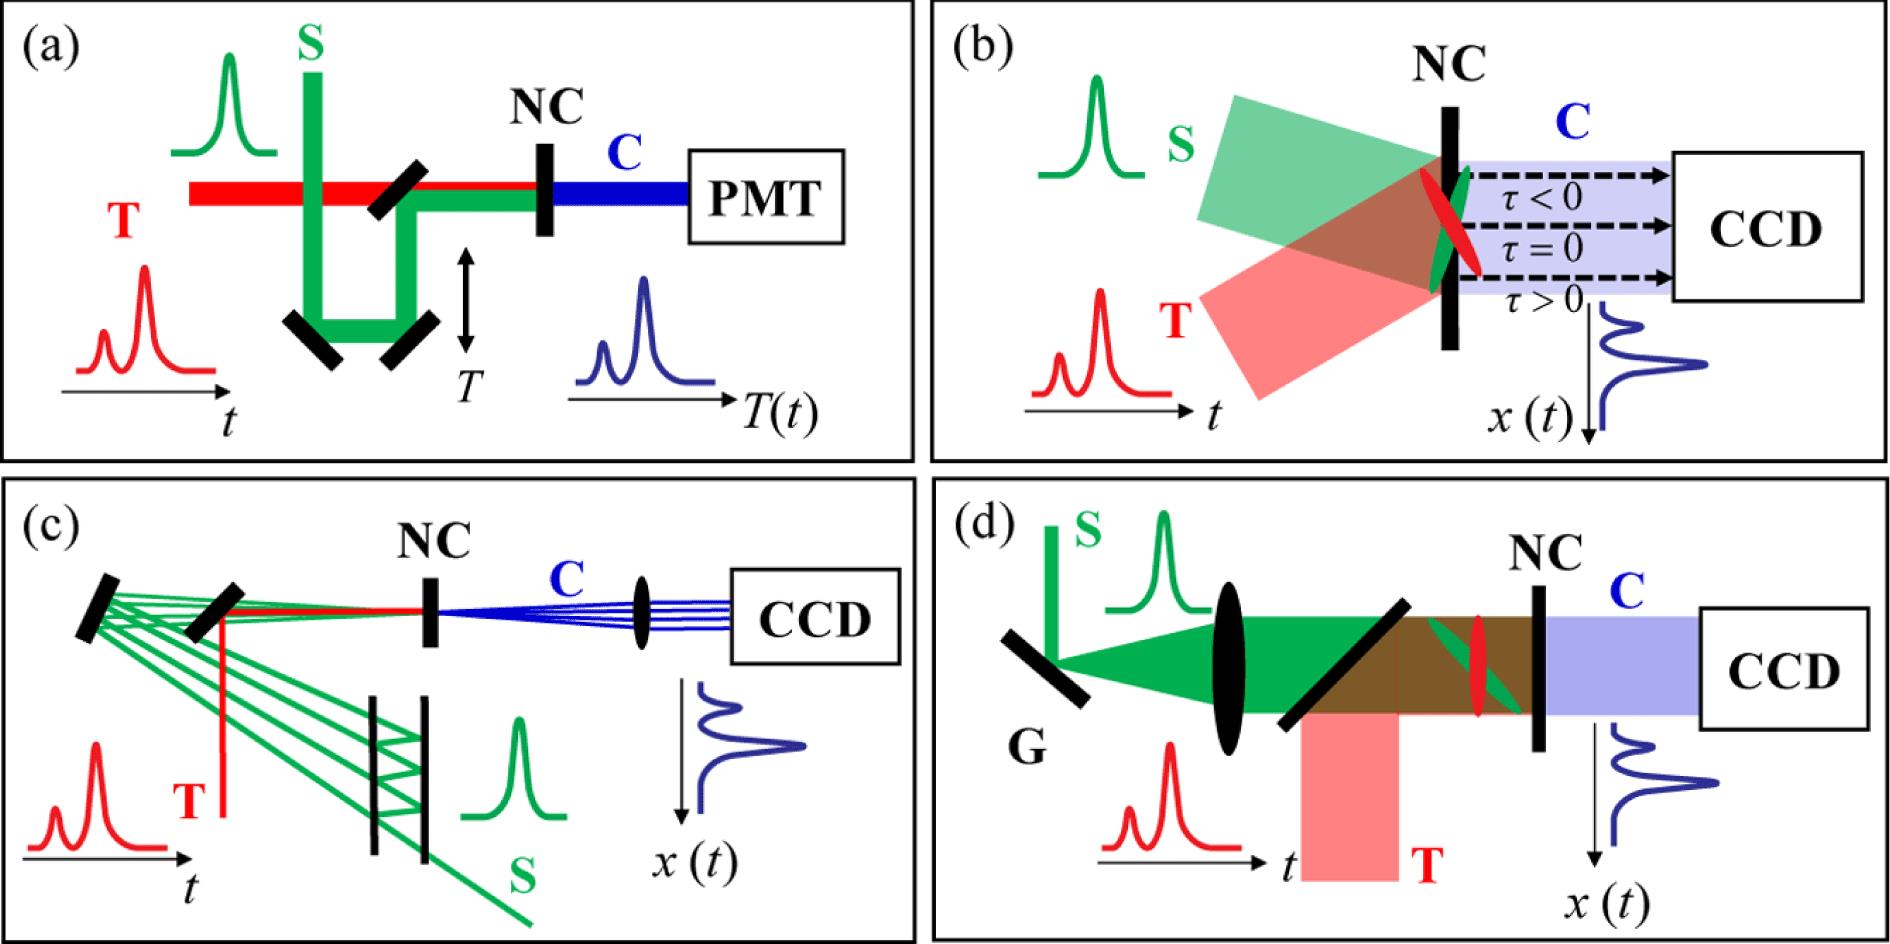
Fig. 1. Schematic diagrams of DSCC and three versions of SSCC. (a) DSCC, in which the temporal window is determined by the delay-scanning line. (b) Noncollinear SSCC, in which the PT and sampling pulses are nonlinearly mixed in a noncollinear configuration. Its temporal window is determined by the noncollinear angle and beam width. (c) SSCC based on a pulse replicator, in which a sequence of spatially shifted and temporal delayed sampling pulses are created to nonlinearly mix with the PT pulse. It has a large temporal window of
 and a temporal resolution of
 . (d) SSCC based on a diffraction grating, in which the tilted pulse front of sampling pulse maps the temporal intensity profile of PT pulse into the spatial intensity profile of generated correlation signal. Its temporal window is determined by the tilting angle of sampling pulse front and the beam width. T, PT pulse; S, sampling pulse; C, correlation signal; NC, nonlinear crystal;
 , time delay of S relative to T.
and a temporal resolution of
. (d) SSCC based on a diffraction grating, in which the tilted pulse front of sampling pulse maps the temporal intensity profile of PT pulse into the spatial intensity profile of generated correlation signal. Its temporal window is determined by the tilting angle of sampling pulse front and the beam width. T, PT pulse; S, sampling pulse; C, correlation signal; NC, nonlinear crystal;
, time delay of S relative to T. 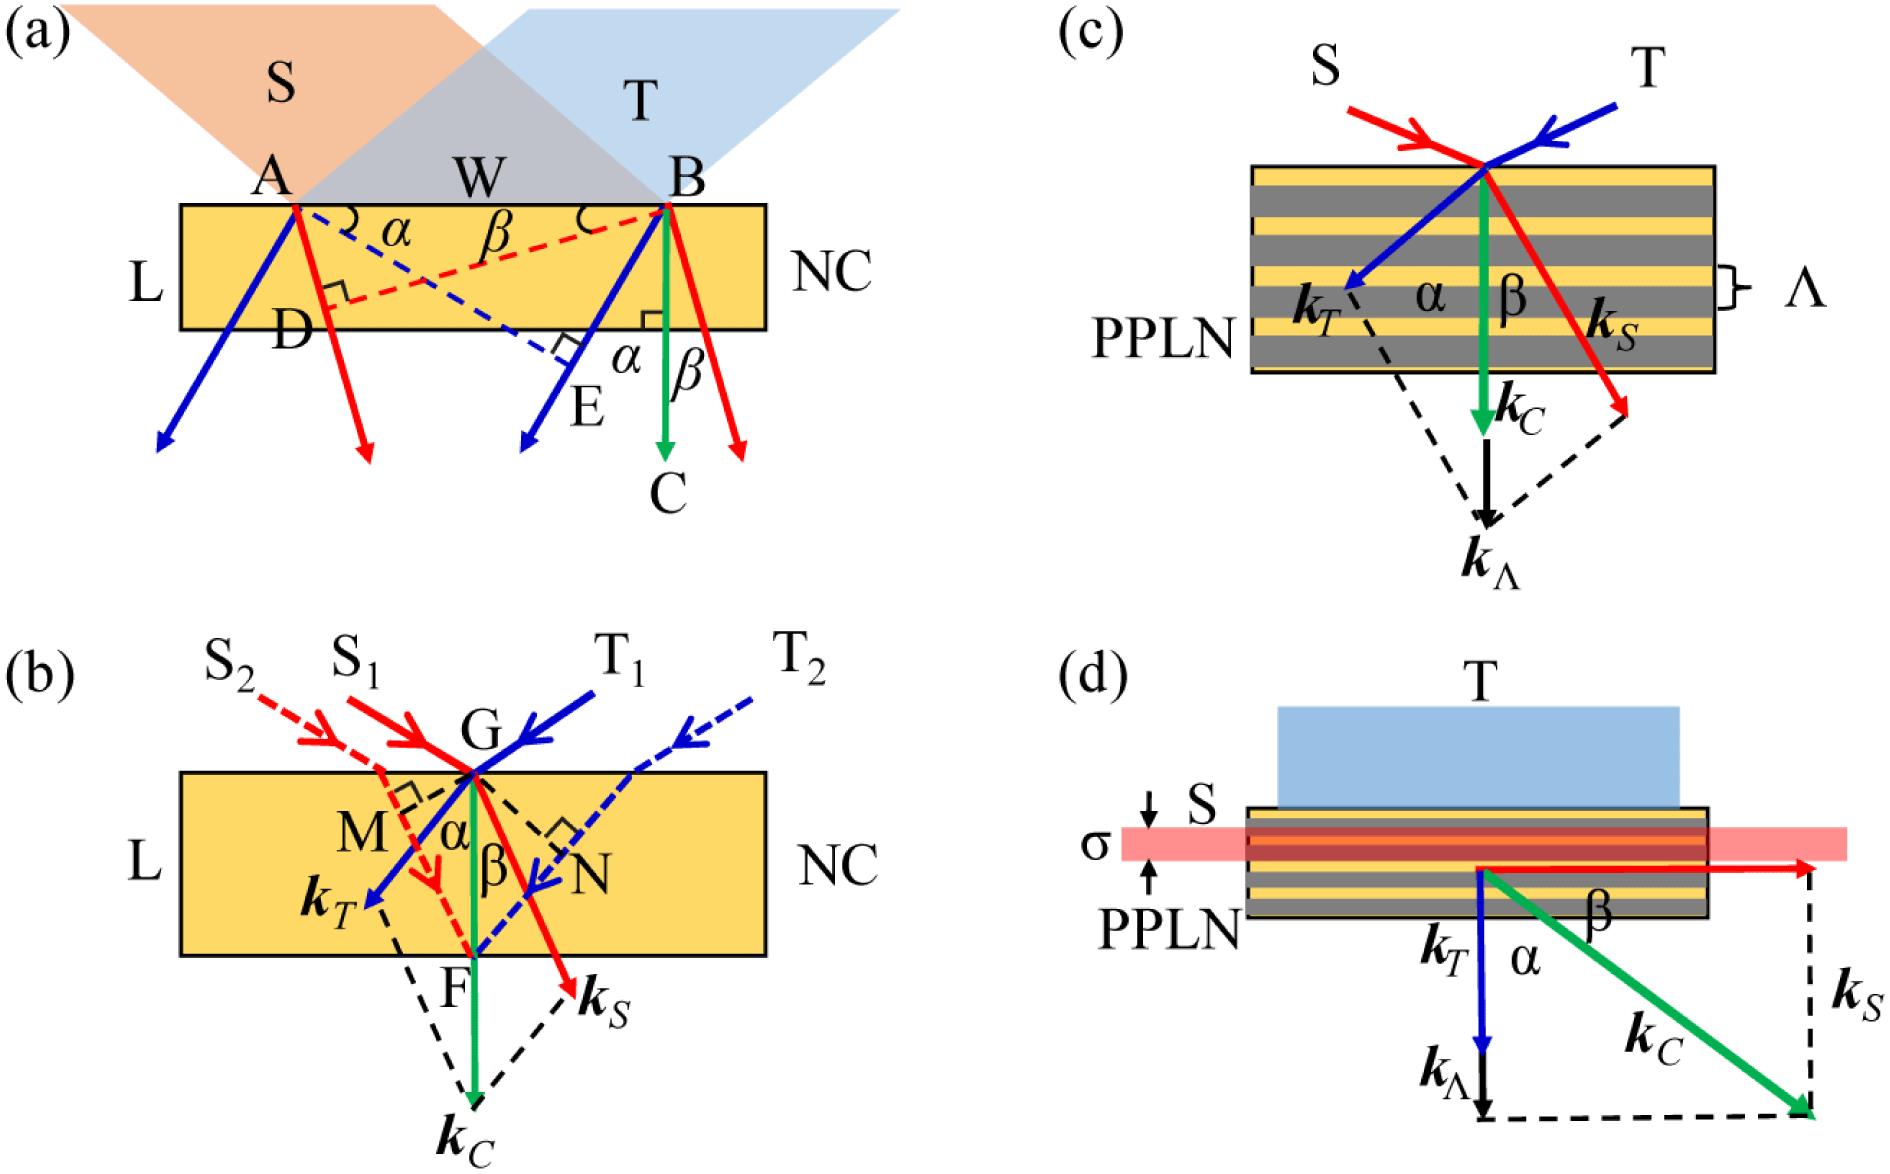
Fig. 2. PM manipulation and crystal design for noncollinear SSCC. (a) SFG cross-correlation with wide slanting interaction beams.
 , intersection angle between T (S) and C within NC;
 , transverse width of intersecting region between T and S;
 , longitudinal length of NC. (b) Plot for the analysis of temporal resolution.
 and
and
 are the wave vectors of T, S and C. (c) QPM design in a PPLN crystal with a poling period of
 .
.
 , the grating
 -vectors provided by PPLN. (d) Lateral cross-correlation supported by high-order QPM.
 , beam diameter of S. Its temporal window is limited by the width of PPLN crystal, while its temporal resolution is limited by the beam size
 .
.
, intersection angle between T (S) and C within NC;
, transverse width of intersecting region between T and S;
, longitudinal length of NC. (b) Plot for the analysis of temporal resolution.
and
are the wave vectors of T, S and C. (c) QPM design in a PPLN crystal with a poling period of
.
, the grating
-vectors provided by PPLN. (d) Lateral cross-correlation supported by high-order QPM.
, beam diameter of S. Its temporal window is limited by the width of PPLN crystal, while its temporal resolution is limited by the beam size
. Fig. 3. (a) Calculated maximum noncollinear angle of SFG (dashed curve) and temporal window (solid curve) with a dependence of sampling wavelength in bulk
 (black curves) and PPLN (red curves) crystals, respectively, for the SSCC configuration shown in Figure
2
(a). (b) Calculated noncollinear angle (dashed curve) and temporal window (solid curve) on the poling period of PPLN for the SSCC configuration in Figure
2
(d). Black (red) curves, the first (third)-order QPM. Cross-correlation trace when the width of the narrow sampling beam is set to be (c)
 and (d)
 . Inset is the corresponding CCD image of correlation signal. The PT pulse is the output of a 50-fs Ti:sapphire regenerative amplifier.
(black curves) and PPLN (red curves) crystals, respectively, for the SSCC configuration shown in Figure
and (d)
. Inset is the corresponding CCD image of correlation signal. The PT pulse is the output of a 50-fs Ti:sapphire regenerative amplifier. Fig. 4. (a) Schematic diagram of high-sensitivity parallel detection system based on fiber array and PMT. Inset shows the widely used CCD-based parallel detection system. NF, neutral filter. (b) System photograph after packaging. (c) A measurement example of pulse contrast with a dynamic range of
 . Reference pulses I, II and III on the correlation trace are achieved by multiple Fresnel reflections of the sampling laser within a 1.1-mm-thick BK7 glass plate.
. Reference pulses I, II and III on the correlation trace are achieved by multiple Fresnel reflections of the sampling laser within a 1.1-mm-thick BK7 glass plate. Fig. 5. Schematic plots for the formation of the SSCC-related artifacts and the methods to remove them. (a) Artificial noise pedestal caused by air scattering of the correlation signal; (b) scattering noise suppression by using a stripe filter. FA, fiber array. SF, stripe filter. (c) The first kind of artificial spikes caused by stray reflection of sampling pulse. (d) A PPLN configuration capable of removing the first kind of artificial spikes. (e) The second kind of artificial spike caused by stray reflection of the correlation signal. (f) Scheme of removing the second kind of artificial spike by controlling the PM condition.
Fig. 6. Measured correlation traces. (a) Measured SSCC traces before (black curve) and after (blue curve) the elimination of the scattering noise using a stripe filter. Red curve shows the DSCC trace for the same PT pulse as a comparison. The two spikes around
 and
and
 are caused by Fresnel reflections of the PT and sampling pulses between the crystal surfaces. Their intensities are comparable because the crystal refractive indexes at the wavelengths of PT and sampling pulses are nearly the same. (b) SSCC traces measured with the designed PPLN crystal with
 . The black and red curves correspond to the PM conditions of (
 ,
,
 ) and (
 ,
,
 ), respectively. The red trace has a higher fidelity by removing the two artificial spikes at
 and
and
 , caused by reflection of correlation signal, to the trailing edge of main pulse.
and
are caused by Fresnel reflections of the PT and sampling pulses between the crystal surfaces. Their intensities are comparable because the crystal refractive indexes at the wavelengths of PT and sampling pulses are nearly the same. (b) SSCC traces measured with the designed PPLN crystal with
. The black and red curves correspond to the PM conditions of (
,
) and (
,
), respectively. The red trace has a higher fidelity by removing the two artificial spikes at
and
, caused by reflection of correlation signal, to the trailing edge of main pulse. Fig. 7. (a) Schematic diagram of noncollinear SSCC. BS, beam splitter;
 , imaging lens;
 , focusing lens. (b) SSCC measurement (red curve) versus Sequoia measurement (blue curve). Tiny spikes at
 and
and
 , appearing on the red trace were the artifacts caused by the two beam splitters used in SSCC.
, imaging lens;
, focusing lens. (b) SSCC measurement (red curve) versus Sequoia measurement (blue curve). Tiny spikes at
and
, appearing on the red trace were the artifacts caused by the two beam splitters used in SSCC. Fig. 8. (a) An exemplary PT pulse profile with a strong prepulse and a noise pedestal around the main pulse. (b)–(d) Presetting procedure for the attenuations of SSCC aiming at measuring the PT pulse shown in (a).
Fig. 9. Two application examples of the SSCC prototypes. (a) Picture of the 1053-nm version and (b) contrast measurement result for the SG-II Nd:glass petawatt laser. (c) Picture of the 800-nm version and (d) contrast measurement result for the SULF-5 PW Ti:sapphire laser.
Fig. 10. Schematic diagram of spatiotemporal cross-correlator (STCC).


Set citation alerts for the article
Please enter your email address

© Copyright 2018-2021 | Chinese Laser Press. All Rights Reserved 沪ICP备15018463号-20