Hsiang I. Hsu, Po-Tsung Wu, and Cheng-Sheng Huang*
Abstract
In this Letter, we demonstrate that by adjusting the thickness of the buffer layer, the optical responses of a guided-mode resonance filter (GMRF) can be improved for sensor applications. The GMRF is fabricated using a replica molding with a plastic substrate and a UV-curable polymer. buffer layers of different thicknesses are deposited before the waveguide-layer deposition. The sensitivity of the GMRFs decreases slightly with increasing layer thickness. By contrast, the full width at half-maximum reduces substantially with increasing layer thickness, resulting in the improvement of the overall figure of merit.Wang and Magnusson[1,2] pioneered guided-mode resonance (GMR) in planar dielectric waveguide gratings. This resonance allows the coupling of an external illumination into the waveguide modes by using the phase matching provided by the gratings. These waveguide modes are immediately reradiated out of the waveguide and into free space and the substrate; hence, they are referred to as “leaky modes.” The forward reradiated leaky modes interfere destructively with the zero-order forward-diffracted waves. By contrast, the backward-reradiated leaky modes are in phase with the zero-order backward-diffracted waves, resulting in constructive interference. This phenomenon manifests experimentally as a transmission dip or reflection peak. GMR has gained increasing attention over the decades and has been used in applications[3–6] such as wideband polarizers, tunable filters, label-free (LF) biosensors, electro-optic modulators, bandpass and band-stop filters, and fluorescence enhancements. Among these, LF biosensors based on a GMR filter (GMRF) are probably one of the most important applications that have been widely used by many research groups for different purposes and have also been commercialized by several companies.
To fabricate subwavelength grating structures in low-cost, high-throughput, large-area patterning, and less processing complexity for commercialization, imprint[7–10] and molding[11–14] methods are often used. In these methods, in general, a Si or glass master mold with a grating pattern fabricated by electron beam lithography or deep-UV photolithography is used to transfer the grating pattern on a polymer film for mass production. Depending on the device or process, the polymer grating pattern replicated from a Si or glass mold may be used as a secondary master mold for the subsequent pattern transfer[10,14] to prevent the damage of the Si or glass mold. After transferring the grating structure to polymer film, deposition of a high refractive index (RI) layer is often required to serve as a waveguiding layer to support leaky modes[10,11,14]. In order to have a higher sensitivity for biosensing applications, the lower RI of substrate is often desired to push the waveguide mode toward the device surface to enhance interaction with adsorbed biomaterials[15]. However, the selection of polymer materials is often limited by the molding methods or the design of devices. In this work, through deposition of a film with lower RI between the polymer grating and waveguiding layer, we can alienate the restriction on the selection of polymer materials and optimize the optical performance for LF biosensing applications.
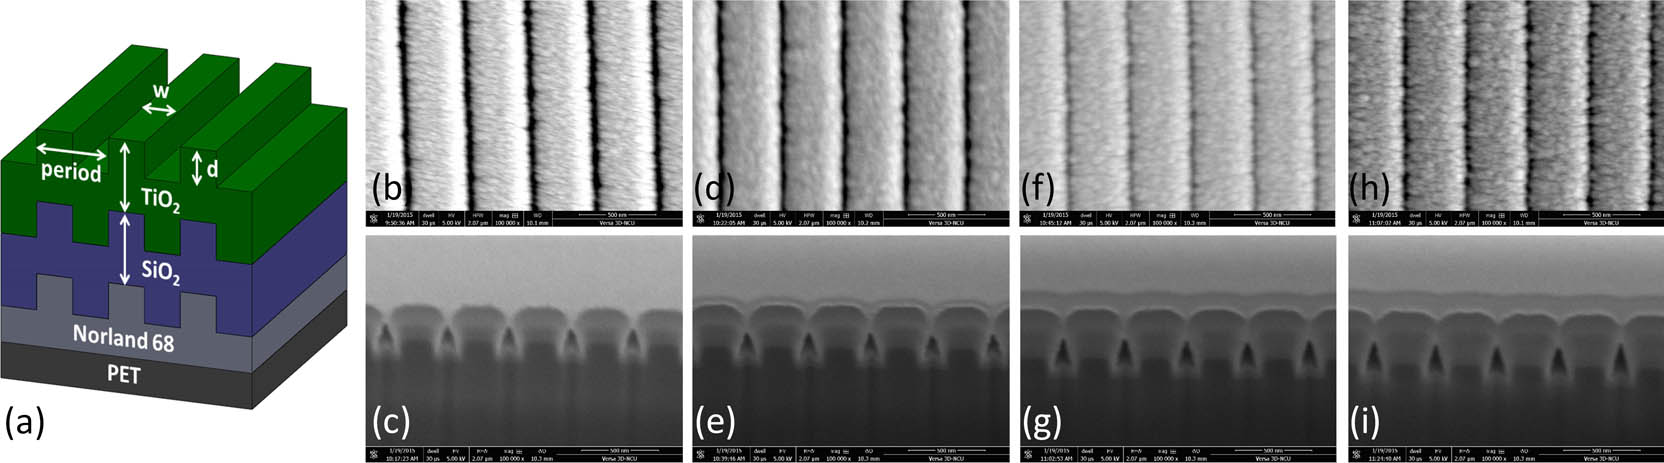
For a low cost and rapid fabrication, a GMRF was fabricated using a replica molding and film deposition. A Si wafer with a grating period of 400 nm and a grating depth of 140 nm, fabricated through electron beam lithography and etching, was used as the master mold. An optical adhesive, NOA68 (, Norland Products, Inc.), was sandwiched between the Si master and a flexible sheet of polyethylene terephthalate (PET). NOA68 was cured through UV exposure, and PET/NOA68 was separated from the Si master. A buffer layer of () was deposited on the NOA68 through sputtering, followed by the deposition of a waveguide layer (, ). The finished GMRF is a simple four-layer structure comprising a plastic supporting substrate, a UV curable polymer with a grating pattern, a buffer layer, and a waveguiding layer, as illustrated in Fig. 1(a). In this study, buffer layers of four thicknesses—156.8, 193.2, 218.6, and 269.2 nm—were deposited to investigate their effect on optical responses. Scanning electron microscopy (SEM) images of the top and cross section of the completed GMRFs of four buffer thicknesses are presented in Figs. 1(b)–1(i).
Sign up for Chinese Optics Letters TOC. Get the latest issue of Chinese Optics Letters delivered right to you!Sign up now

Figure 1.(a) Schematic of a four-layer GMRF; SEM images of the top and cross section for thickness of 156.8 (b), (c), 193.2 (d), (e), 218.6 (f), (g), and 269.2 nm (h), (i).
With increasing layer thickness, the top section of the GMRF expanded laterally, decreasing the deposition rate in the valleys and eventually preventing further deposition in such regions. This phenomenon is evident in cross-sectional images in Fig. 1, in which the thickness is lower in the valleys than at the top, and does not exist (or exists in extremely minimal quantities) in the valley. Because the film also grows laterally, a cavity is eventually formed when the thickness is further increased. The top view reveals that the slightly topographical difference is the resulting different duty cycles caused by the different thicknesses. A duty cycle is defined as the ratio of the width of the top portion [Fig. 1(a)] to the period, which was 0.885, 0.893, 0.915, and 0.925 for the four layers deposited in this study.
As discussed previously, when a broadband light source is at a normal incidence angle to the GMRF, a narrow band of wavelength is reflected and the remaining light is transmitted; this is observed as a dip in the transmission measurement. To obtain the transmission spectra, an optical fiber with collimating lens connected to a broadband light source (LS-1-LL, Ocean Optics) was used to illuminate the GMRF normally. A polarizer was placed in between the GMRF and the fiber to obtain the desired polarization. Transverse magnetic polarization was used for all simulations and experiments because of the resulting narrower peak, which potentially provides a high resolution for sensor applications. The transmitted light was collected by another fiber connected to a spectrometer.
For comparison, the transmission spectra were simulated according to a rigorous coupled-wave analysis by using a simulation tool (DiffractMOD, RSoft Design Group). For enhanced accuracy, the geometries used in RSoft for the different thicknesses were based on the SEM cross-sectional image with rounded corners and slanted sidewalls, as shown in Fig. 2(a) ( and are not to scale). Because of the thick () NOA68 layer, the PET layer was neglected and only three layers were simulated.
Figure 2.(a) Cross-sectional view of one period in the RSoft simulation. (b) The measured (M) and simulated (S) transmission spectra of the GMRF with two film thicknesses. (c) The resonant wavelength as a function of thickness for both the simulated and measured results.
The transmission spectra of the bare GMRF (without any solution on the surface) with the different thicknesses were measured using a 1.5 nm-resolution spectrometer (USB2000+VIS-NIR-ES, Ocean Optics). Both the simulated and measured transmission spectra for the two layer thicknesses were consistent in terms of resonant wavelength and full width at half-maximum (FWHM), as shown in Fig. 2(b). The simulated and observed resonant wavelengths increased with the thickness [Fig. 2(c)]. The slight discrepancy in the resonant wavelengths of the simulation and experimental results are probably due to the difference in the RIs of and in the simulated and actual devices.
A major application of the GMRF is as a LF biosensor, which has already been commercialized by several manufacturers. Two of the most crucial parameters that affect the detection are sensitivity and resolution. Sensitivity is defined as the change of an output signal (shift of the resonance wavelength for GMRF) as a function of the change of RI on the sensor surface, and the resolution refers to the minimum change of the spectral shift that can be measured accurately, a parameter associated with the noise of the detection system. In an optical biosensor, the resolution is typically scaled linearly by using the FWHM of the resonance peak[16,17]; thus, a sensor with a narrower FWHM tends to achieve a higher resolution. The narrowness of the resonance peak can also be defined as the quality factor (Q factor), where . Here, is the resonant wavelength of the optical resonator. By combining these two parameters, the figure of merit (FOM), defined as the ratio of sensitivity and FWHM, is often used to characterize the performance of LF optical sensors. Ideally, a sensor with a high sensitivity and resolution (narrow FWHM or high Q factor), which yields a high FOM, is desired.
To study the effect of the buffer thickness on sensitivity and resolution, a sucrose solution with various concentrations—0% [only deionized (DI) water], 15%, 30%, 45%, and 65%, with a corresponding RI of 1.333 (DI water), 1.356, 1.381, 1.410, and 1.453, respectively[18], covering the typical RI range of biosamples—was used. When the solution was added on top of the GMRF, the RI contrast between and the reduced solution was compared with that of the bare GMRF and the top cladding of air; this reduced the FWHM of the resonance peak. To determine the FWHM more accurately, all transmission spectra of the solution were measured using a 0.1 nm resolution spectrometer (Princeton Instruments Acton SP2500).
Figure 3(a) is an example of the measured transmission spectra for different sucrose solutions of the GMRF with 156.8 nm . The corresponding resonant wavelengths with different solutions were simulated on the basis of the model shown in Fig. 2(a), in which we changed the RI of the cladding to that of the solution. Comparisons of the resonant wavelength and the RI for both simulated and experimental results for 156.8 nm are summarized in Fig. 3(b). At this RI range, the sensitivities, calculated using the slope of the linear fitted line, were 139.72 and 134.96 nm/RIU for the experimental and simulated results, respectively. Although the resonant wavelengths shift slightly between the experimental and simulation results, the simulated sensitivity provides a valuable reference to the measurement. The same procedure was applied to GMRFs with different thicknesses, and the results are presented in Fig. 4 for both the simulated and experimental results.
Figure 3.(a) Measured transmission spectra for different sucrose concentrations. (b) The resonant wavelength versus RI for the simulation and experimental results.
Figure 4.(a) Simulated FWHM and Q factor as a function of the thickness and (c) the simulated sensitivity and FOM as a function of the thickness. (b) The experimental FWHM and Q factor as a function of the thickness and (d) experimental sensitivity and FOM as a function of the thickness.
As discussed previously, the resolution of optical biosensors is related to the FWHM of the resonance peak. Because the FWHM varies slightly with the RI of the solution [Fig. 3(a)], to investigate the effect of the thickness we calculated the FWHM with [Fig. 4(a)]. The simulation demonstrates that the FWHM can be reduced from 1.220 to 0.368 nm when the is increased from 156.8 to 269.2 nm, which indicates that the narrowness of the peak is reduced by a factor of 0.3. Thus, a higher Q factor of GMRF can be achieved by increasing the thickness. According to our results, the Q factor can be improved by 3.3 times (from 545.98 to 1815.22) when the thickness is increased from 156.8 to 269.2 nm.
For the experimental results, 15% sucrose was used to determine the FWHM for different thicknesses [Fig. 4(b)]. The FWHM can be reduced by approximately 0.42 times, from 2.425 to 1.015 nm; this corresponds to the improvement of the Q factor by 2.39 times, from 278.43 to 665.42. The lower Q factor of the experiment compared with that of the simulation is probably due to the loss of energy because of the scattering in or the imperfection of the fabricated device. Nevertheless, both the experimental and simulation results indicate that by increasing the thickness, a higher Q factor (i.e., a narrower FWHM) can be obtained.
When the thickness is increased from 156.8 to 269.2 nm, the simulated sensitivity decreases from 134.96 to 124.59 nm/RIU and the measured sensitivity decreases from 139.72 to 122.02, a 7.7% and 12.7% decrease from the measured and simulated values, respectively. For both the simulation and the measurement, the thickness of does not drastically affect the sensitivity as much as it does the FWHM. Despite the slight decrease in sensitivity with increasing thickness, the overall FOM can be substantially improved because of the significant reduction in the FWHM. The simulation result indicates that FOM can be improved from 110.62 to 338.56 by increasing the from 156.8 to 269.2 nm. In comparison, the experimental results depict a lower degree of improvement because of a broader FWHM. Nevertheless, by increasing the thickness the measured FOM can be improved from 57.62 to 120.22.
This study investigates the optical responses to the sensitivity and resolution of GMRF for use as an optical sensor when a lower RI buffer layer is deposited between a polymer grating substrate and a waveguiding layer. The experimental results are verified using simulation models. The sensitivity reduces slightly; by contrast, the FWHM is reduced considerably as the buffer thickness was increased. Therefore, the FOM can be improved substantially by increasing the buffer thickness; this is beneficial to biosensor applications.
References
[1] S. S. Wang, R. Magnusson. Appl. Opt., 32, 2606(1993).
[2] R. Magnusson, S. S. Wang. Appl. Phys. Lett., 61, 1022(1992).
[3] B. T. Cunningham, L. Laing. Expert Rev. Proteomics, 3, 271(2006).
[4] N. Ganesh, W. Zhang, P. C. Mathias, E. Chow, J. A. N. T. Soares, V. Malyarchuk, A. D. Smith, B. T. Cunningham. Nat. Nanotechnol., 2, 515(2007).
[5] D. W. Dobbs, I. Gershkovich, B. T. Cunningham. Appl. Phys. Lett., 89, 123113(2006).
[6] R. Magnusson, M. Shokooh-Saremi, K. J. Lee, J. Curzan, D. Wawro, S. Zimmerman, W. Wu, J. Yoon, H. G. Svavarsson, S. H. Song. Proc. SPIE, 8102, 810202(2011).
[7] A. Pokhriyal, M. Lu, V. Chaudhery, C.-S. Huang, S. Schulz, B. T. Cunningham. Opt. Express, 18, 24793(2010).
[8] Y. Hirai, M. Fujiwara, T. Okuno, Y. Tanaka, M. Endo, S. Irie, K. Nakagawa, M. Sasago. J. Vac. Sci. Technol. B, 19, 2811(2001).
[9] Y. Kanamori, H. Katsube, T. Furuta, S. Hasegawa, K. Hane. Jpn. J. Appl. Phys., 48, 06FH04(2009).
[10] A. Pokhriyal, M. Lu, V. Chaudhery, S. George, B. T. Cunningham. Appl. Phys. Lett., 102, 221114(2013).
[11] B. Cunningham, B. Lin, J. Qiu, P. Li, J. Pepper, B. Hugh. Sens. Actuators B-Chem., 85, 219(2002).
[12] C. S. Huang, S. George, M. Lu, V. Chaudhery, R. M. Tan, R. C. Zangar, B. T. Cunningham. Anal. Chem., 83, 1425(2011).
[13] Y. Tan, C. Ge, A. Chu, M. Lu, W. Goldshlag, C. S. Huang, A. Pokhriyal, S. George, B. T. Cunningham. IEEE Sens. J., 12, 1174(2012).
[14] H. Y. Li, W. C. Hsu, K. C. Liu, Y. L. Chen, L. K. Chau, S. Hsieh, W. H. Hsieh. Sens. Actuators B, 206, 371(2015).
[15] I. D. Block, L. L. Chan, B. T. Cunningham. Sens. Actuators B, 120, 187(2006).
[16] I. M. White, X. Fan. Opt. Express, 16, 1020(2008).
[17] J. Hong, K. H. Kim, J. H. Shin, C. Huh, G. Y. Sung. Opt. Express, 15, 8972(2007).
[18] International Commission for Uniform Methods of Sugar Analysis. Analyst, 62, 4(1937).