
Takato Mori, Akifumi Yogo, Yasunobu Arikawa, Takehito Hayakawa, Seyed R. Mirfayzi, Zechen Lan, Tianyun Wei, Yuki Abe, Mitsuo Nakai, Kunioki Mima, Hiroaki Nishimura, Shinsuke Fujioka, Ryosuke Kodama. Feasibility study of laser-driven neutron sources for pharmaceutical applications[J]. High Power Laser Science and Engineering, 2023, 11(2): 02000e20
- High Power Laser Science and Engineering
- Vol. 11, Issue 2, 02000e20 (2023)
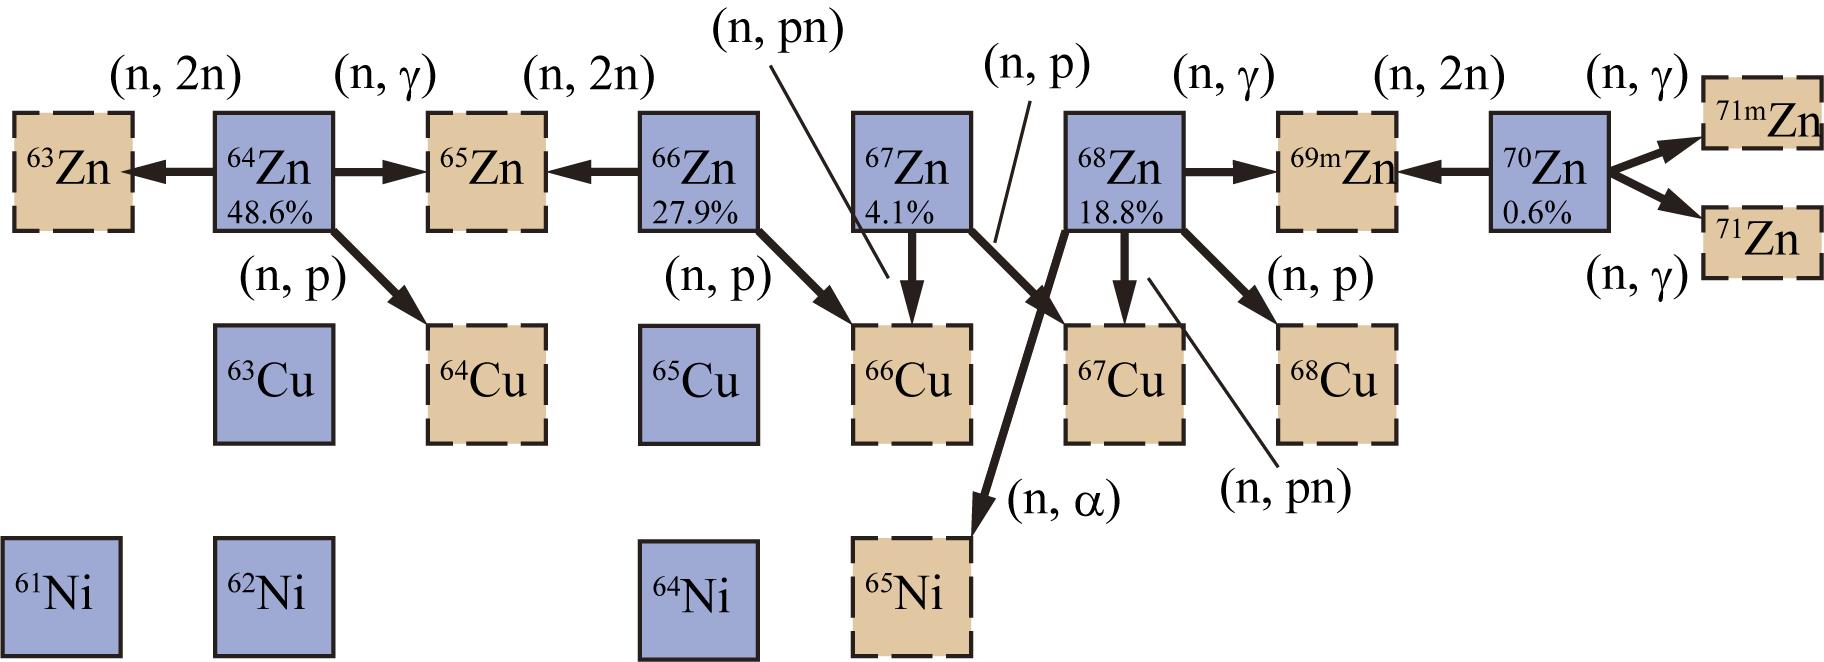
Fig. 1. Partial nuclear chart around Zn and nuclear reactions with neutrons on a natural Zn target.  Cu,
Cu,  Cu and
  Cu are produced by (n, p) reactions with high-energy neutrons on
  Zn,
Zn,  Zn and
  Zn, respectively.
  Cu,
Cu,  Cu and
  Cu
Cu are produced by (n, 2n) reactions on
  Zn,
Zn,  Zn and
  Zn, respectively.
  Cu and
  Cu
Cu are generated by (n, pn) reactions from
  Zn and
  Zn, respectively. High-energy neutrons could produce
  Ni by the
  Zn(n,
Zn(n,  )
) Ni reaction. Neutron capture also occurs.
Cu, Cu and Cu are produced by (n, p) reactions with high-energy neutrons on Zn, Zn and Zn, respectively. Cu, Cu and Cu are produced by (n, 2n) reactions on Zn, Zn and Zn, respectively. Cu and Cu are generated by (n, pn) reactions from Zn and Zn, respectively. High-energy neutrons could produce Ni by the Zn(n, )Ni reaction. Neutron capture also occurs. 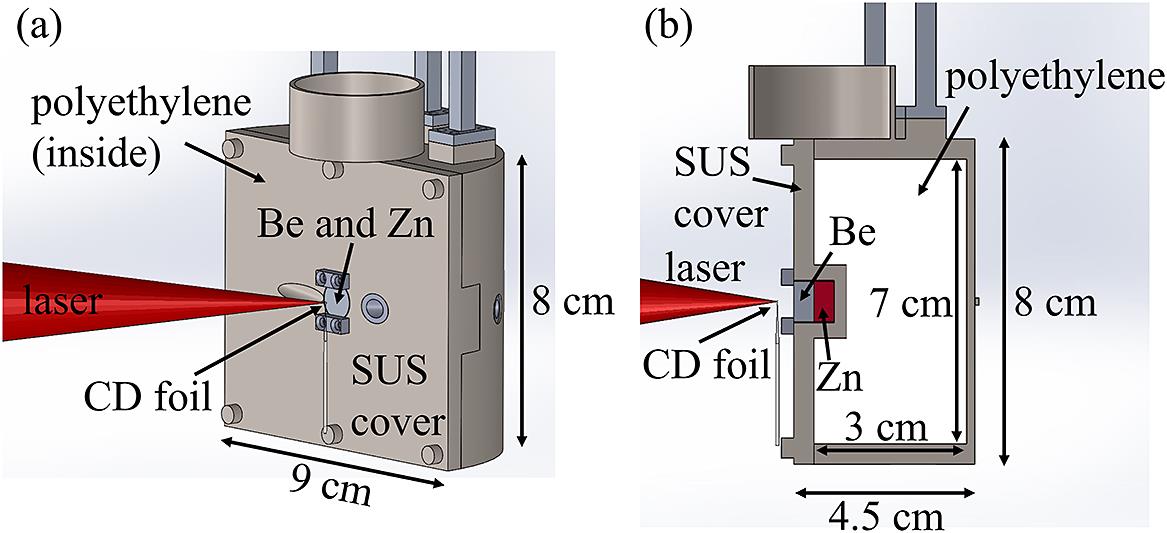
Fig. 2. Experimental setup for the laser shot to generate neutrons. The laser is focused on the CD foil target. The Be neutron converter is placed 4 mm downstream of the CD foil. Behind the Be target, the Zn target was set in the hole at the center of the front surface.
Fig. 3. Fast neutron spectrum obtained from the TOF measurement. The neutron energies reached 17 MeV.
Fig. 4.  -ray spectra measured for 120 h, 8.1 h, 5.1 h and 8 min. (a)–(c) The
  -ray spectra integrated for 120 h. The background signal measured for 99 h was normalized to the target measurement of 120 h. (d) The
  -ray spectrum measured for 8.1 h, where peaks corresponding to
  Zn
Znm are observed. (e) The  -ray spectrum for 5.1 h, where peaks for
  Ni are observed. (f) The
  -ray spectrum for 8 min, which shows the
  Cu
Cum peak at 526 keV.
-ray spectra measured for 120 h, 8.1 h, 5.1 h and 8 min. (a)–(c) The -ray spectra integrated for 120 h. The background signal measured for 99 h was normalized to the target measurement of 120 h. (d) The -ray spectrum measured for 8.1 h, where peaks corresponding to Zn-ray spectrum for 5.1 h, where peaks for Ni are observed. (f) The -ray spectrum for 8 min, which shows the CuFig. 5. Cross sections used in the simulation calculation, which are taken from the JENDL-4.0 nuclear data library.
Fig. 6. Geometry of the calculation of the yield of  Cu using a laser for an optimized target system. (a) Cross-sectional view of the Be and
  Zn target. (b) 3D image of the target.
Cu using a laser for an optimized target system. (a) Cross-sectional view of the Be and Zn target. (b) 3D image of the target.
| |||||||||||||||||||||||||||||||||||||||||||||||||||||||||||||||||||||||||||||||||||||||||||||||||||||||||||||||||||||||||||||||||||||||||||||||||||||||||
Table 1. Produced nuclides and their half-lives,  -ray energies, emission probabilities of the
  -rays, nuclear reactions, numbers and activities.
-ray energies, emission probabilities of the -rays, nuclear reactions, numbers and activities.
| ||||||||||||||||||||||||||||||||||||||||||||||||||
Table 2. Experimental activities, calculated activities and their ratio of the obtained activities in the present experiment. The calculated activities were obtained using the PHITS simulation code with the measured neutron energy spectrum.

Set citation alerts for the article
Please enter your email address
© Copyright 2018-2021 | Chinese Laser Press. All Rights Reserved 沪ICP备15018463号-20