
Shifei Liu, Jiande Zhang, Zicheng Zhang. Review of high power compact pulse forming network-Marx generators[J]. High Power Laser and Particle Beams, 2022, 34(7): 075001
- High Power Laser and Particle Beams
- Vol. 34, Issue 7, 075001 (2022)
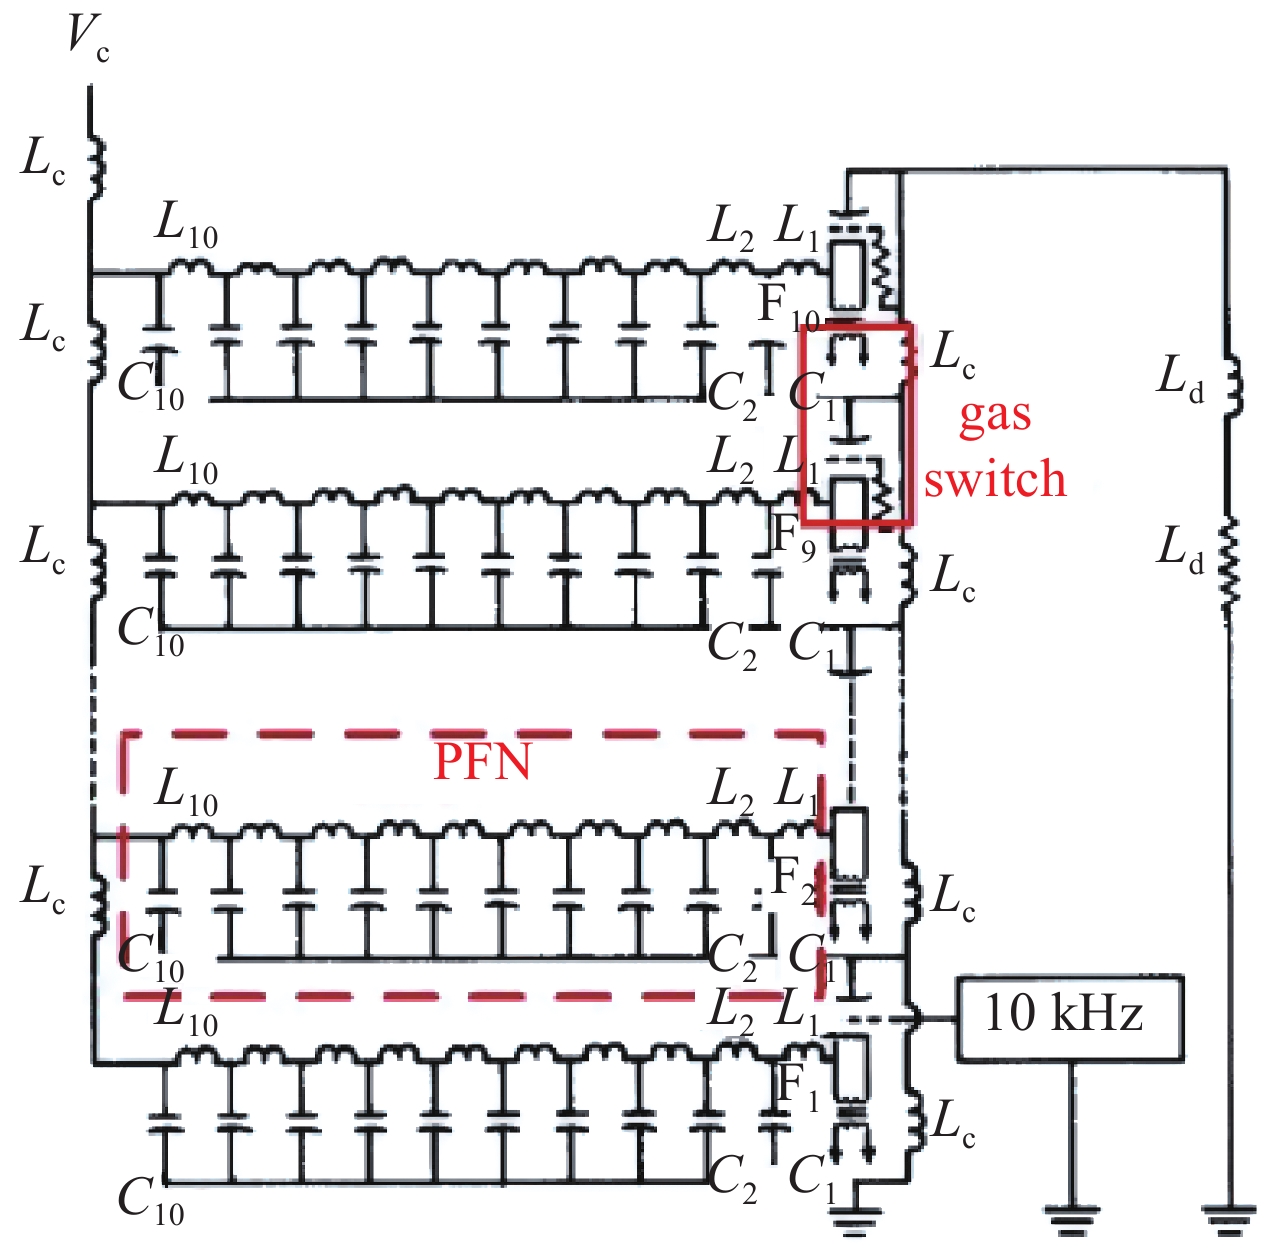
Fig. 1. Typical circuit diagram of PFN-Marx generator
Fig. 2. NRCC setup diagram of PFN-Marx generator
Fig. 3. Waveform of output pulse
Fig. 4. AE setup diagram of PFN-Marx generator
Fig. 5. Waveform of output pulse
Fig. 6. TTU setup diagram of PFN-Marx generator
Fig. 7. Structural diagram of a PFN
Fig. 8. PAL setup diagram of PFN-Marx generator
Fig. 9. Waveform of output pulse
Fig. 10. APELC circuit diagram of PFN-Marx generator
Fig. 11. Waveform of output pulse
Fig. 12. CAEP setup diagram of PFN-Marx generator
Fig. 13. Waveform of output pulse
Fig. 14. Indian setup diagram of PFN-Marx generator
Fig. 15. Peaking gap and the peaking capacitor
Fig. 16. Waveform of output pulse without peaking capacitor
Fig. 17. Waveform of output pulse with peaking capacitor
Fig. 18. CEAEA setup diagram of PFN-Marx generator
Fig. 19. Waveform of output pulse
Fig. 20. CAEP setup diagram of PFN-Marx generator
Fig. 21. Structural diagram of a PFN
Fig. 22. Waveform of output pulse
Fig. 23. NUDT setup diagram of PFN-Marx generator
Fig. 24. Waveform of output pulse
Fig. 25. NUDT structural diagram of a PFN
Fig. 26. Waveform of output pulse
| ||||||||||||||||||||||||||||||||||||||||||||||||||||||||||||||||||||||||
Table 1. Comparison of typical device parameters

Set citation alerts for the article
Please enter your email address
© Copyright 2018-2021 | Chinese Laser Press. All Rights Reserved 沪ICP备15018463号-20