1School of Materials Science and Engineering, Shanghai University, Shanghai 200444, China
2Shagnhai Institute of Ceramics, Chinese Academy of Science, Shanghai 201899, China
3Jiangsu Key Laboratory of Advanced Laser Materials and Devices, School of Physics and Electronic Engineering, Jiangsu Normal University, Xuzhou 221116, China
4Shanghai Institute of Optics and Fine Mechanics, Chinese Academy of Science, Shanghai 201800, China
5School of Physics Science and Engineering, Institute for Advanced Study, Tongji University, Shanghai 200092, China
6Institute of Low Temperature and Structure Research PAS. Okolna 2 Street, Wroclaw 50-422, Poland
Ruijuan Li, Xiaodong Xu, Liangbi Su, Qinglin Sai, Changtai Xia, Qiuhong Yang, Jun Xu, Adam Strzęp, Anita Półkoszek. Crystal characterization and optical spectroscopy of Eu3+-doped CaGdAlO4 single crystal fabricated by the floating zone method[J]. Chinese Optics Letters, 2016, 14(2): 021602
Copy Citation Text
A highly transparent -doped (CGA) single crystal is grown by the floating zone method. The segregation coefficient, x ray diffraction, and x ray rocking curve are detected, and the results reveal that the single crystal is of high quality. The transitions of in the host lattice are discussed. The emission transition at 621 nm (red light) is dominant over the emission transitions at 591 and 599 nm (orange light), agreeing well with the random crystal environment of ions in a CGA crystal. The decay time of is measured to be 1.02 ms. All the results show that the Eu:CGA crystal has good optical characterization and promises to be an excellent red- fluorescence material.
Nowadays, white light-emitting diodes (W-LEDs), due to their compact size, eco-friendliness, high brightness, low energy consumption, and long lifetime, are regarded as a viable substitute for traditional incandescent lamps and fluorescent lamps[1]. At present, the most popular W-LED device is phosphor-converted white LEDs[2,3]. However, the phosphor of W-LEDs still has many drawbacks, such as large light decline, poor uniformity, deficiency of red emission[4], a short lifetime, and poor physical and chemical characteristics, which is unfavorable for the performance of the W-LED[1]. Recently, some researchers devoted their attention to the fields of non rare earth (non-RE) such as Bi ion-doped phosphors[5–7] to solve the problems above, and have made great progress in the light decline and deficiency of red emission. However, there are still more problems than a single crystal can solve[8]. Therefore, it is urgently required to seek more stable single crystals to act as substitutes for the red fluorescent materials.
Europium ions have attracted a great deal of attention for their wide use in the field of display and illumination since 1960s. As one of the most frequently used red-emitting activators, the ion mainly shows characteristic emissions with high intensity from the transitions of (, 1, 2, 3, 4, 5, 6)[9,10], and has a long fluorescent lifetime[11].
CGA single crystals have a perovskite structure that belongs to the family of compounds, where , Sr, or Ba, rare-earth element, and , Al, or a transition element[12,13]. The crystal’s structure is a three-dimensional net composed of connected octahedra. and ions occupy the same site with a site occupancy factor equal to 0.5. These ions are coordinated by nine oxygen ions[14,15]. Therefore, the dopant ions are distributed in a disorderly manner in the CGA single crystal and occupy the sites without or deviated from inversion symmetry[2]. Due to the high thermal conductivity ( along the -axis and along the -axis), favorable thermal expansion coefficient ( and along the - and -axes, respectively), and high mechanical strength (Mohs hardness 6), lanthanide-doped CGA crystals are good candidates for fluorescent and laser materials[16,17]. To date, all of the reported results concerning Ln-doped CGAs are focused on the spectroscopic properties of IR-relevant ions such as , , , and [18–21]. Therefore, in this Letter, we present a report concerning the spectroscopic properties of -doped CGA single crystals.
Sign up for Chinese Optics Letters TOC. Get the latest issue of Chinese Optics Letters delivered right to you!Sign up now
CGA single crystals can be grown by the Czochralski (CZ) method. Due to the strong thermal expansion anisotropy, the crystal growth process is nontrivial, and the obtained boules often posses cleavages parallel to the (001) crystallographic plane[22]. However, the floating zone (FZ) method possesses some advantages over the CZ method in the growth of these sorts of materials. FZ is much faster and cheaper due to the lack of expensive crucibles. Moreover, the several-millimeter-diameter crystals grown by the FZ method possess a rod-like shape and are thought to have potential as a material for miniature optical device applications because light can pass through the cylindrical crystal without complicated processing[23].
In this Letter, we present the results of different investigations carried on -doped CGA single crystals grown by the FZ method. The x ray diffraction (XRD), rocking curve, segregation coefficient, and spectra properties of the Eu:CGA crystal were studied.
A single crystal doped with (2 at. %) was grown by the FZ technique. The starting materials were , , , and with 5 N purity. They were mixed with stoichiometric proportions. Afterwards, anhydrous ethanol was added, and the obtained slurry was well ground in a ball mill. The mixed powder was dried and pressed into rods (~130 mm long, 10 mm in diameter) by a cold isostatic press (applied pressure: 200 MPa, pressing time: 2 min). The obtained rods were sintered at 1250°C for 20 h for decarbonation in air. Single-crystal growth was carried out in an optical floating-zone furnace (IRF01-001-00, Quantum Design Corporation, America). A CGA single crystal bar () oriented in the 〈100〉 direction was used as a seed. The sintered rods were rotated at 10 rpm, and the single crystal was grown at a speed of 3–4.5 mm/h in the air atmosphere. Moreover, in order to assure the uniform composition of the molten zone, an opposite rotation at the same rotation speed is necessary[24].
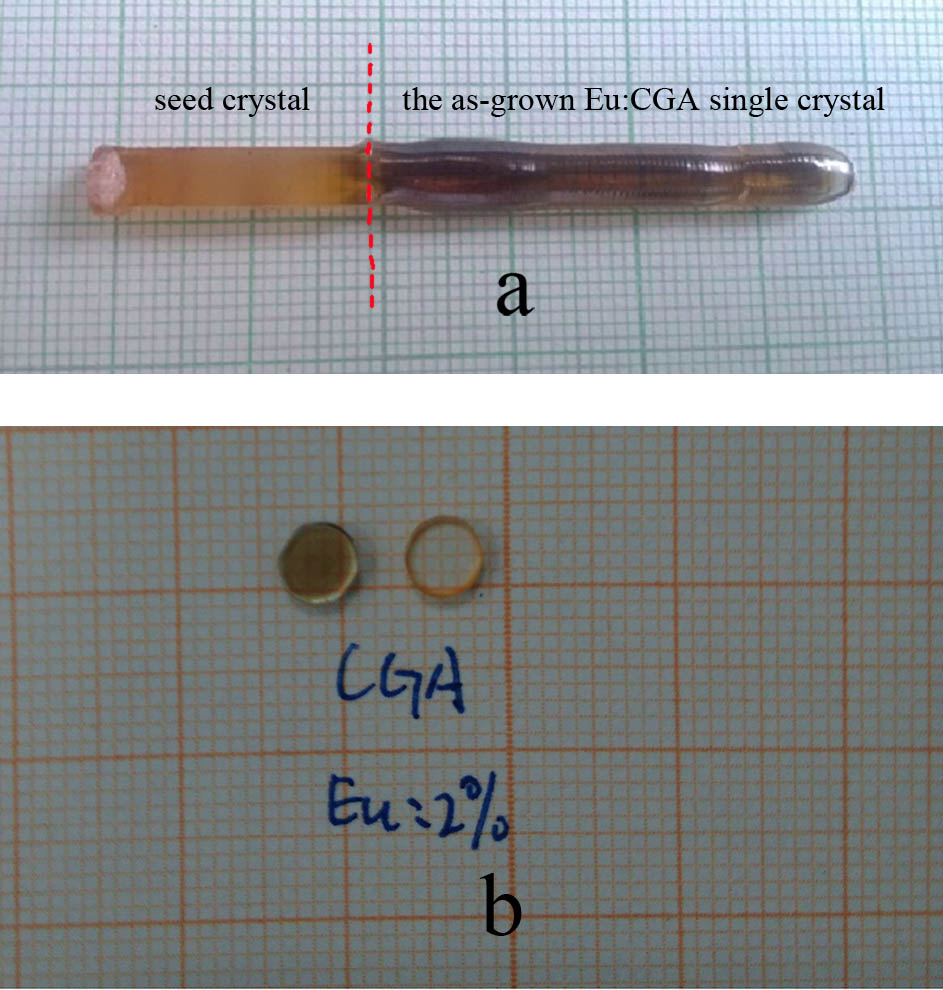
Long and geometrically homogeneous textured cylindrical rods have been obtained [see Fig. 1(a)]. The rod was cut along the (001) plane into ~1 mm thick slices, as shown in Fig. 1(b). As shown in Fig. 1(a), the Eu:CGA single crystal is transparent and slightly brown in color. Color is relevant to the colored centers, which are related to the oxygen vacancies in the crystal structure. Therefore, the piece was annealed in for 20 h at 1250°C to eliminate the colored center. As shown in Fig. 1(b), the right piece, which was transparent, was annealed in , compared to the left, which is an as-grown crystal.
Figure 1.(a) Photograph of Eu:CGA single crystal grown by the FZ method. (b) Photograph of Eu:CGA obtained slices: the left one is as grown, and the right one is an annealed crystal.
The crystal structure of Eu:CGA was analyzed by XRD using Cu radiation (D8-Advance, Bruker, Germany). Data was recorded over a range of 10°–70° with a 0.02° step. The rocking curve for the crystal was measured by a high resolution x ray diffractometer (D8-Discover, Bruker, Germany). The segregation coefficient of the ion in the CGA crystal was measured by an inductively coupled plasma atomic emission spectrometer (ICP-AES). The absorption spectra were measured by a Cary 5 E Varian spectrophotometer. The emission spectra were measured by exploiting a DongWoo Optron DM750 monochromator coupled to an R-928 Hamamatsu photomultiplier. The luminescence decay kinetics were measured with the use of a Coherent Inc. Libra femtosecond laser coupled with a light conversion OPerA optical parametric amplifier (OPA) as an excitation source and a Princeton Instruments ACTON 2500i monochromator coupled with a Hamamatsu C5680 streak camera. All spectroscopic measurements were carried out on the annealed samples. All measurements were performed at room temperature. For polarized experiments, a Harrick PGT-S1 V Glan-Tylor polarizer was used.
The XRD patterns of the grown crystal and appropriate Joint Committee On Powder Diffraction Standards (JCPDS) database entry (no. 24-0192) are shown in Fig. 2. The diffraction patterns of the obtained material are in very good agreement with the database record. The cell parameters of the Eu:CGA and pure CGA crystals were calculated from the diffraction data and are listed in Table 1. The calculated parameters for both the doped and pure CGA are quite similar, which is evidence of the integrity of the Eu:CGA structure. The incorporation of dopant ions leads to the extension of the unit cell. This fact can be easily explained: the larger ions act as substitutes for the smaller ions in the crystal structure (, ). The site occupancy is expected to be determined largely by considerations of ionic size. In consequence, ions are expected to preferentially occupy sites because the radius of (1.120 Å) is closer to those of (1.18 Å) and (0.938 Å), and is much larger than that of (0.535 Å). In addition, the similar valency is the other favorable factor to determine the site occupancy, which makes it preferred that the ions in the host be replaced by ions[25].
A, B (nm)
C (nm)
V (nm3)
CGA
0.3660
1.1971
0.1604
CGA:Eu
0.3661
1.1986
0.1606
Table 1. Cell Parameters of Eu:CGA and CGA Single Crystals
The result of the rocking curve for the Eu:CGA crystal is shown in Fig. 3. The only peak indicates that the as-grown crystal is a single crystal. The full width at half-maximum of the rocking curve for the Eu:CGA crystal is about 17 arcsec, which shows the high crystallinity of the crystal grown by the FZ method.
Figure 3.Result of the rocking curve for the as-grown Eu:CGA single crystal.
The segregation coefficient of in the Eu:CGA crystal can be calculated from the following formula: where and are the concentrations in the crystal and melt, respectively, when there is a solid–liquid equilibrium[20,26]. Approximately, we calculate as the concentration at the growth starting position in the crystal, and as the doping concentration. The element analysis results are listed in Table 2. The segregation coefficient of was calculated to be 0.96. The reason is that the radius of is larger than the radius of , leading to the slight lattice distortion and difficulties in replacing the . The obtained value of the segregation coefficient suggests that should be uniformly distributed along the crystal boule[27].
Crystal
Measured (wt. %)
Calculated molar number (at. %)
C0(at. %)
Segregation coefficient of Eu3+
Eu:CGA
1.01
1.92
2
0.96
Table 2. Element Analysis Results From the ICP-AES of the Obtained Eu:CGA Single Crystal
The polarized absorption spectra of Eu:CGA in the range of 300–475 nm are shown in Fig. 4, Both spectra are dominated by a strong line occurring at 399 nm that is related to the transition. The absorption bands lack a refined structure due to the random crystal environment, which affects the influence of the crystal field on the Eu ions. The Eu ions are located in a site that is randomly occupied by ; therefore, the Eu ions distributed in a disorderly manner in the Eu:CGA single crystal. All tetragonal crystals are optically uniaxial. For those crystals, the optical axis is parallel to the crystallographic -axis. The differences between the and polarization absorption spectra reflect the anisotropy of Eu:CGA crystal. The effective absorption coefficients of the transition at 399 nm for polarization and polarization were calculated to be 3.85 and , the full widths at half-maximum were 1.58 and 1.62 nm, and the absorption cross sections were calculated to be and , respectively.
Figure 4.Polarized absorption spectra of Eu:CGA single crystal at room temperature.
Figure 5 shows the emission spectra of the Eu:CGA in the region from 500–750 nm under the 399 nm excitation. Some characteristic emission lines correspond to the transitions from the excited state to the ground states (, 1, 2, 3, 4): (581 nm), (591 nm, 599 nm), (613 nm, 621 nm), (658 nm), and (691 nm, 701 nm). Among these emission bands, 621 nm () is observed to be the most intense. From the emission spectra, we can only find the emission transitions from the state to . While the transitions from the to the multiplet are expected in theory, the absence of emissions could be due to the existence of higher energy phonons in the CGA, and also could be due to fast nonradiative multiphonon relaxations from these levels to the level.
Figure 5.Emission spectra of Eu:CGA single crystal from 500 to 750 nm.
The transition is a magnetic dipole transition and is allowed with selection rule according to the parity selection rules, while the electric dipole emission transition is forbidden based on selection rule [13]. If an ion occupies a site with inversion symmetry, the orange emission due to the allowed magnetic dipole transition will be dominant. If it occupies the non-inversion symmetry environment, the transition is not strictly forbidden, but it is a hypersensitive and forced electric dipole transition. Then, the electric dipole transition at 621 nm with a bright red emission is dominant. The dominance of the emission transition at 621 nm suggests that is located at a non-inversion symmetry position in CGA, basically agreeing with the random crystal environment of ions[28].
Crystal field splitting for rare-earth ions is usually small as compared to the gaps between J multiplets belonging to a definite LJ term, defined as the LSJ terms (Here the L, S, J represent the orbital quantum number, spin quantum number and total angular momentum quantum number respectively)[29]. In this case, the splitting lines observed at the peaks at 591, 621, 658, and 701 nm (shown in Fig. 5) can be attributed to the crystal field spectra of . The space group for the tetragonal crystals is I4/mmm. The and sites have C4v point symmetry. Crystal field splitting for the following lines is expected from the theoretical analysis: splits into 2 levels (electric dipole transition and magnetic dipole transition), splits into 2 levels (electric dipole transition), splits into 2 levels, and splits into 4 levels, but we can only find 3 levels at 701 nm, for the other is too weak to see. Only one emission peak at 581 nm corresponding to the transition was detected, reflecting that the ions occupy only one kind of crystallographic site[30], which is also consistent with the results of the cell parameters we calculated in Table 1.
The luminescence decay characteristic of Eu:CGA excited by femtosecond laser pulses () at room temperature is shown in Fig. 6. The decay curve could be well fitted with a single exponential function, ( is the initial intensity at , and represents the 1/e lifetime)[25]. The decay time was calculated to be 1.02 ms, which is a moderate value for oxide materials doped with ions such as nanocrystalline phosphors (0.76 ms)[31], tellurite ceramics (0.93 ms)[32], zinc-tellurite glasses (0.98 ms)[33], and monophosphate (0.98 ms)[34]. All these results indicate that doped in a CGA crystal can be an effective luminescence material.
Figure 6.Decay curves of the level in the Eu:CGA crystal.
In conclusion, we successfully grow an Eu:CGA single crystal by the FZ method. The XRD, x ray rocking curve, segregation coefficient, polarized absorption spectra, emission spectra, and luminescence decay kinetics are used to characterize the sample. The result of XRD indicates the structural integrity of the Eu:CGA, and the crystal shows a full width at half-maximum as small as 17 arcsec by the x ray rocking curve measurement. Both results reveal that the single crystal we grow is of high quality. The segregation coefficient is estimated to be 0.96, close to 1, which is helpful in improving the efficiency of the fluorescence. From the spectrum, the transitions of in the host lattice are assigned and discussed in detail. The absorption cross sections are calculated to be and at 399 nm for polarization and polarization. Two lines at 599 and 621 nm are observed in the emission spectra of the and transitions, and the latter line is much stronger than the former line, which is due to the random crystal environment of ions in a CGA single crystal. The decay time of is measured to be 1.02 ms, slightly longer than some other -doped media. All the results show that Eu:CGA crystal has good optical characterization and promises to be an excellent red fluorescence material.
Ruijuan Li, Xiaodong Xu, Liangbi Su, Qinglin Sai, Changtai Xia, Qiuhong Yang, Jun Xu, Adam Strzęp, Anita Półkoszek. Crystal characterization and optical spectroscopy of Eu3+-doped CaGdAlO4 single crystal fabricated by the floating zone method[J]. Chinese Optics Letters, 2016, 14(2): 021602