Yuxin Wang, Jie Yuan, Sidan Du, Xiaojun Liu, Guan Xu, Xueding Wang, "Adaptive multi-sample-based photoacoustic tomography with imaging quality optimization," Chin. Opt. Lett. 13, 061001 (2015)
Copy Citation Text
The energy of light exposed on human skin is compulsively limited for safety reasons which affects the power of photoacoustic (PA) signal and its signal-to-noise ratio (SNR) level. Thus, the final reconstructed PA image quality is degraded. This Letter proposes an adaptive multi-sample-based approach to enhance the SNR of PA signals and in addition, detailed information in rebuilt PA images that used to be buried in the noise can be distinguished. Both ex vivo and in vivo experiments are conducted to validate the effectiveness of our proposed method which provides its potential value in clinical trials.
Research on photoacoustic tomography (PAT) got prosperous development for its being promisingly characterized with noninvasive and nonionizing diagnose of breast cancer, arthritis, and relevant disease. PAT combines the metrics of both ultrasound imaging and pure optical imaging technique, providing high ultrasonic resolution and high optical contrast images[1–5]. Due to the peculiarity that the optical absorption characteristic of blood has a strong relationship with the hemoglobin content, functional imaging as well as structural imaging can also be realized by PAT, making this imaging modality extremely potential in clinical application[6].
The basic principle of PAT is that a tissue is irradiated with short nanosecond laser pulses, and then the absorbed energy may result in a thermo-elastic expansion and subsequent contraction of irradiated volume that generates time-trace photoacoustic (PA) waves, which can be acquired by scanning small-aperture ultrasound detectors over a surface that encloses the source under study. The recorded PA wave can then be reconstructed to spatially resolve the initial absorber distribution and concentration via PA reconstruction algorithms[7–9]. However, biomedical tissue is a highly scattering medium for electromagnetic waves in the optical spectral range, and the propagation ultrasound waves are extremely attenuated before received by ultrasound sensors. Furthermore, the dose of laser beam exposed on the biomedical tissue has to be limited under for safety operation. Thus, in clinical trials, ultrasound transducer can only receive weak PA signals with low signal-to-noise ratio (SNR) which degraded the final reconstructed PA images[10–14]. This Letter proposes an adaptive multi-sample-based approach to enhance the SNR of PA signals and in addition, detailed information of PAT that used to be buried in the noise and artifacts can be distinguished.
The PA reconstruction is an inverse problem of the source pressure. We assume that a tissue with inhomogeneous microwave absorption but a relatively homogeneous acoustic property and the heat diffusion’s effect on the thermoacoustic wave can be ignored. For cases where the scanning radius in a circular scan configuration is much greater than the PA wavelengths, the optical absorption within the sample at a given position is given as[1]πβwhere is the speed of sound; β is the isobaric volume expansion coefficient; is the heat capacity; is the detector position with respect to the imaging cente; is the PA signals detected at each scanning angle . can be calculated through inverse Fourier transform[15]where donates the inverse Fourier transform; is angular frequency; is a window function to depress the high-frequency noise, which is characterized by a cutoff angular frequency . In our work, we chose Hanning window, which has smooth edge shape and less calculation complexity
Sign up for Chinese Optics Letters TOC. Get the latest issue of Chinese Optics Letters delivered right to you!Sign up now
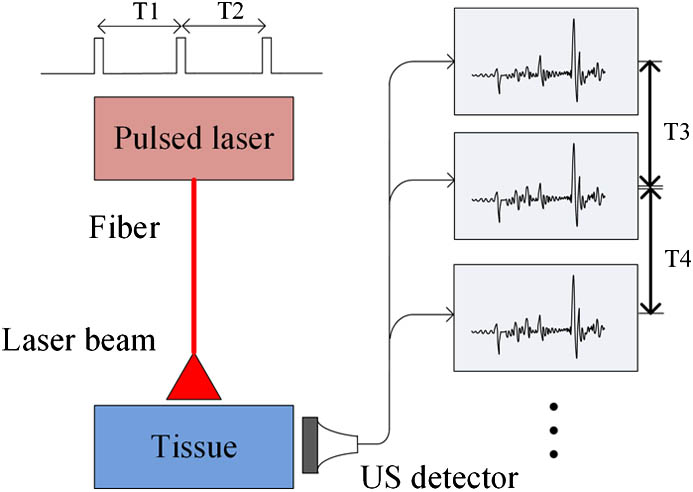
We can discern from Eq. (1) that the SNR of the received PA signals is of great importance to the image quality of PAT. Normally, using single-sampled PA signal can only build a low-SNR PA image. Since the PA signal and the random noise are uncorrelated in each measurement procedure, we can apply averaging frames using multi-sample method to enhance the SNR of reconstructed PA images. However, after applying multi-sample method, with the improvement of SNR, in real biomedical tissue, the spatial resolution and detailed information of reconstructed PAT image is hardly increased (as shown in a subsequent paragraph). This abnormal phenomenon can be explained by the schematic in Fig. 1.
Figure 1.Schematic of the multi-sampling procedure.
Due to the uncertainty accumulated by the whole experiment system, there always exists tiny time shift between different PA frames. While the interval time between two sequenced pulsed lasers is precisely fixed (), the ultrasound signals received are not perfectly aligned (μ).
By calculating the cross correlation between the two PA frames and , the time shift can be determined. For continuous signals, the cross correlation is defined as where is the complex conjugation of . With the cross correlation[16], can be determined according to the time offset between zero and the highest peak. For discrete signals and , their cross correlation is where is the maximum length of signal and . However, using Eq. (5) can only get a maximal precision of shift time between and at , where is the sample frequency of the receiving system. With times interpolation on and , the precision of shift time will increase times. In our work, shift time is calculated by applying cubic spline interpolation[17] on receiving signals before using Eq. (5). With correct , received PA signals are aligned and averaged as where is the interpolated length of PA signal; is the number of sampled frames; are the shifted PA frames. Finally, times sample is applied on to generate PA signal for imaging
Our experiment system integrates a tunable optical parametric oscillator laser (Vibrant B, Opotek Inc., Carlsbad, CA, USA) pumped by the second harmonic output of a Nd:YAG pulsed laser (Brilliant B, Quantel, Bozeman, MT, USA) as the illumination source. The laser system is turned to 720 nm which gives the maximum output energy of 60 mJ/pulse. The pulsed laser beam with a repetition rate of 10 Hz and pulse width of 5.5 ns illuminates the imaging domain. A Verasonics system (Model V3, Redmond, WA, USA) was programmed to work with a computer. To build real-time PA images, we applied our hardware-based optimization method in experiments[18]. In addition, we applied our linear delay compensation optimization method (similar to the concept of beamforming) to build full-range focused PA images[19]. The schematic diagram of the imaging system is shown in Fig. 2.
Figure 2.Schematic diagram of the experiment system.
The first experiment is conducted with a phantom containing four human hairs. These hairs are fixed on a U-shaped plastic holder. A metal shank is also attached on it so as to make it submerge in water. We use the Philips CL15-7 transducer probe (liner array, 128 elements, center frequency at 9 MHz with 0.178 mm element pitch) to detect the PA signals. The probe is vertical to the hairs in order to get the cross section image of the four hairs. Figure 3(a) shows the model of our phantom. Figure 3(b) is the reconstructed PA image using one sample frame which contains strong background noise and artifacts. Figures 3(c) and 3(d) are the reconstructed PA images with simple multi-frame average method and our proposed multi-frame method, respectively. Both results come from the same 10 sampled frames. In this work, we applied interpolation to rectify the random shift between sample frames. It is apparent that the noise and artifacts in Fig. 3(d) is effectively depressed and the four human hair sections can be easily discerned from the background.
Figure 3.Human hair phantom reconstruction: (a) Model of the phantom. (b) PA image with single sample frame. (c) PA image with traditional multi-sample-based method. (d) PA image with our multi-sample-based method.
To quantify the effect of our method, we compare the peak SNR (PSNR; as shown in Table 1) of the reconstructed PA images. For all four human hairs, when computing their PNSRs, the background is set to a region far away from the region of interest. In Table 1, PNSR_S is the PSNR of the PA image reconstructed using one sample frame, PSNR_N is the PSNR of the PA image reconstructed using simple multi-sample averaging method, and PSNR_M is the PSNR of the PA image reconstructed using our multi-sample-based approach. From Table 1 we can see that 6 dB quality improvement is achieved after applying our proposed method.
Hair No.
1
2
3
4
PSNR_S (dB)
58.6098
59.2684
56.7737
59.4863
PSNR_N (dB)
62.8133
63.1143
60.4926
63.0089
PSNR_M (dB)
64.4487
65.5755
62.9599
65.3259
Table 1. PSNR Improved with Multi-Sample-Based Approach
Another experiment is conducted with a volunteer’s index finger, which is fixed to avoid moving artifacts in the process of PAT. The laser beam is parallel to the finger while vertical to the CL15-7 probe. Figure 4(a) is the reconstructed PA image using one sample frame. Figures 4(b) and 4(c) are the reconstructed PA images of the same target using simple multi-frame average method and our proposed method, respectively. We can see that, as a whole, Fig. 4(b) presents better image quality than Fig. 4(a) especially in the regions where we mark in the colored line (Regions A–C). Figure 4(c) is even better than Fig. 4(b) in presenting clear infrastructures. To quantify the quality of reconstructed PA images, PSNR comparison among different methods is listed in Table 2 which indicates that our proposed method has overwhelming advantages over other ones. Furthermore, we additionally include a B-mode ultrasound image [shown as Fig. 4(d)] of the same target for comparison. This in vivo experiment proves that reconstructed PA image with our proposed method strictly match the biomedical infrastructure (tendon, bone, joint, periosteum, and inner structure of tendon) to those in ultrasound image. To enhance the noise and artifacts, these images are displayed using nonlinear gray level.
Region
One-Sample-Based Method
Simple Multi-Sample-Based Method
Our Method
A
36.5235
43.3422
46.4543
B
33.3890
41.9003
44.0908
C
35.7781
43.0783
45.6740
Table 2. PSNR Comparison between Different Approaches
Figure 4.Images of human index finger joint: (a) PA image using one sample frame. (b) PA image using simple multi-frames average method. (c) PA image using our proposed multi-frame-based method. (d) B-mode ultrasound image; BO, bone; IN, inner structure of tendon; JO, joint; PE, periosteum; TE, tendon.
In conclusion, we adaptively utilize repeatedly sampled PA signals to yield optimized biomedical PA images which not only suppress the noise and artifacts, but also enhance the detailed information in reconstructed images. We hope our improved multi-sample-based approach will benefit future clinical trials and other in vivo research.