• Acta Photonica Sinica
  • Vol. 50, Issue 10, 1017001 (2021)
Lixin LIU1、2, Meijie QI1, Peng GAO1, Ping XUE3, and Junle QU4、*
Author Affiliations
  • 1School of Physics and Optoelectronic Engineering,Xidian University,Xi'an 710071,China
  • 2CAS Key Laboratory of Spectral Imaging Technology,Xi'an 710119,China
  • 3State Key Laboratory of Low-Dimensional Quantum Physics,Department of Physics,Tsinghua University,Beijing 100084,China
  • 4Key Laboratory of Optoelectronic Devices and Systems,College of Physics and Optoelectronic Engineering,Shenzhen University,Shenzhen,Guangdong 518060,China
  • show less
    DOI: 10.3788/gzxb20215010.1017001 Cite this Article
    Lixin LIU, Meijie QI, Peng GAO, Ping XUE, Junle QU. Application of Fluorescence Lifetime Imaging in Cancer Diagnosis(Invited)[J]. Acta Photonica Sinica, 2021, 50(10): 1017001 Copy Citation Text show less
    Fluorescence lifetime detection methods[14,16-17]
    Fig. 1. Fluorescence lifetime detection methods1416-17
    Fluorescence lifetime estimation
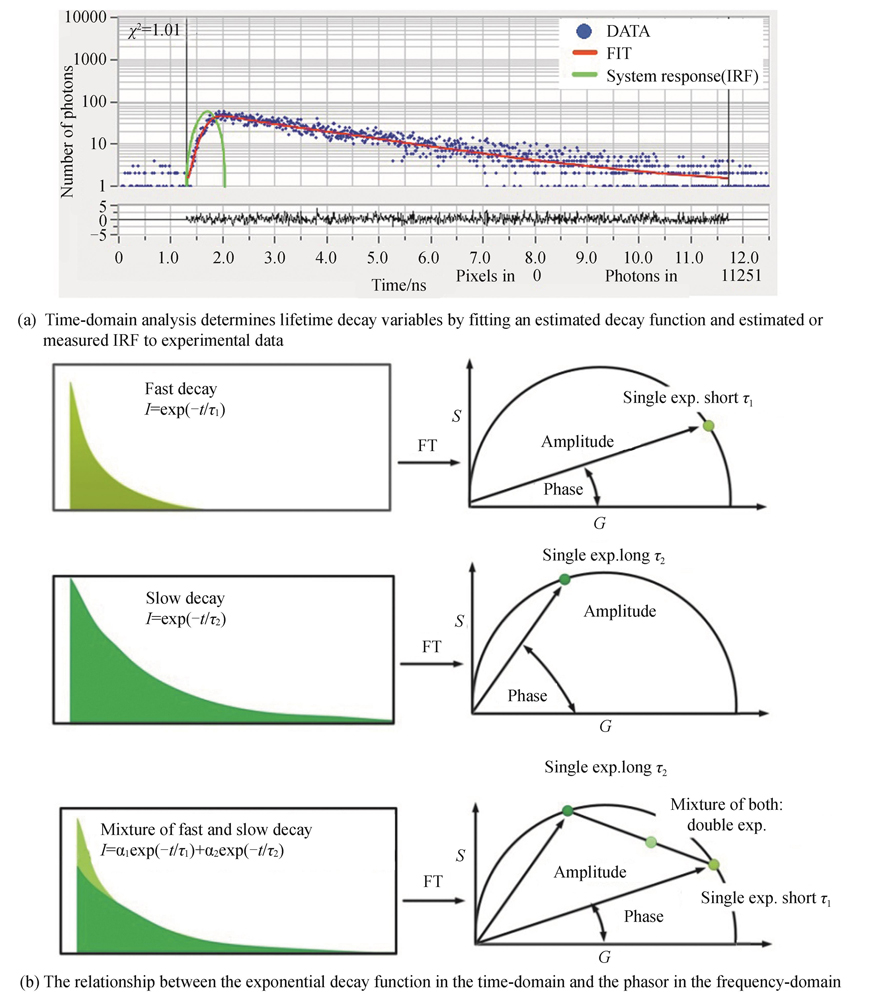
    Fig. 2. Fluorescence lifetime estimation
    The number of papers which focus on FLIM used in cancer research
    Fig. 3. The number of papers which focus on FLIM used in cancer research
    Live 22 GSC cells have increased OCR and corresponding increased mean NADH lifetimes(τm)and increased amount of bound NADH(α2%)compared with NSCs[42]
    Fig. 4. Live 22 GSC cells have increased OCR and corresponding increased mean NADH lifetimes(τm)and increased amount of bound NADH(α2%)compared with NSCs42
    The bright field images,NADH and FAD fluorescence intensity distributions and fluorescence lifetime images in MRC5,H661 and A549[46]
    Fig. 5. The bright field images,NADH and FAD fluorescence intensity distributions and fluorescence lifetime images in MRC5,H661 and A54946
    Multispectral FLIM feature maps of SCC and normal tongue tissue from the same patient,pixel distributions of normal and SCC maps for each feature are also compared[55]
    Fig. 6. Multispectral FLIM feature maps of SCC and normal tongue tissue from the same patient,pixel distributions of normal and SCC maps for each feature are also compared55
    Fluorescence lifetime-coded 3D structures of the normal and diseased human gastric antrum mucosa[59]
    Fig. 7. Fluorescence lifetime-coded 3D structures of the normal and diseased human gastric antrum mucosa59
    White light image,fluorescence integrated intensity image,intensity-weighted FLIM images and lifetime distribution histograms of a fresh hemicolectomy specimen containing a moderately differentiated colonic adenocarcinoma[58]
    Fig. 8. White light image,fluorescence integrated intensity image,intensity-weighted FLIM images and lifetime distribution histograms of a fresh hemicolectomy specimen containing a moderately differentiated colonic adenocarcinoma58
    FLIM images,phasor FLIM plot and the density graphic of the central coordinates of phasor FLIM of a normal cervical tissue sample,a CIN1 sample,and a CIN3 sample[66]
    Fig. 9. FLIM images,phasor FLIM plot and the density graphic of the central coordinates of phasor FLIM of a normal cervical tissue sample,a CIN1 sample,and a CIN3 sample66
    Fluorescence Lifetime images,respective average lifetime histogram and variation of mean amplitude lifetime of healthy,low grade and high grade tumor cells at 870 nm excitation wavelength[73]
    Fig. 10. Fluorescence Lifetime images,respective average lifetime histogram and variation of mean amplitude lifetime of healthy,low grade and high grade tumor cells at 870 nm excitation wavelength73
    Phasor-FLIM analysis of MCF-7 cells after incubation with PAH-Cit/DOX for 6 h[78]
    Fig. 11. Phasor-FLIM analysis of MCF-7 cells after incubation with PAH-Cit/DOX for 6 h78
    Representative pHm images and the corresponding pHm distributions obtained from the PL lifetime of QD-SS20-MPA nanosensors incorporated into the mitochondria of MCF7,MDA-MB-231 and MDA-MB-468[79]
    Fig. 12. Representative pHm images and the corresponding pHm distributions obtained from the PL lifetime of QD-SS20-MPA nanosensors incorporated into the mitochondria of MCF7,MDA-MB-231 and MDA-MB-46879
    FLIM analysis of mouse SCC tumor tissue and normal tissue[86]
    Fig. 13. FLIM analysis of mouse SCC tumor tissue and normal tissue86
    Distinction among AK,BD,and BCC using image segmentation based on a phasor plot of the fluorescence lifetime imaging of H&E-stained sections[90]
    Fig. 14. Distinction among AK,BD,and BCC using image segmentation based on a phasor plot of the fluorescence lifetime imaging of H&E-stained sections90
    Lixin LIU, Meijie QI, Peng GAO, Ping XUE, Junle QU. Application of Fluorescence Lifetime Imaging in Cancer Diagnosis(Invited)[J]. Acta Photonica Sinica, 2021, 50(10): 1017001
    Download Citation