Author Affiliations
1Key Laboratory of Ecosystem Network Observation and Modeling, Institute of Geographic Sciences and Natural Resources Research, CAS, Beijing 100101, China;2National Ecosystem Science Data Center, Beijing 100101, China;3University of Chinese Academy of Sciences, Beijing 100049, China;4College of Resources and Environment, University of Chinese Academy of Sciences, Beijing 100049, Chinashow less
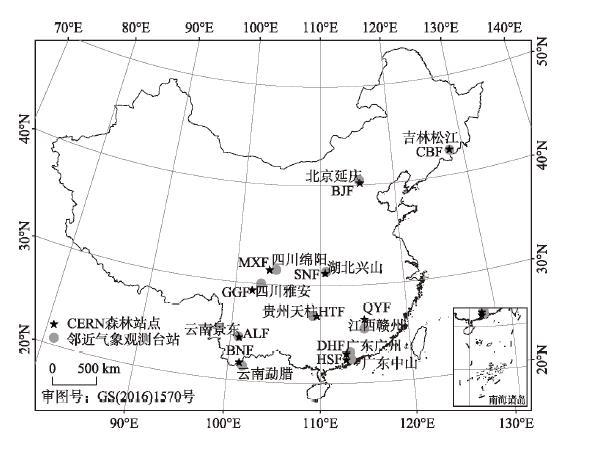
Fig. 1. Distribution of 11 typical forest ecosystems in China
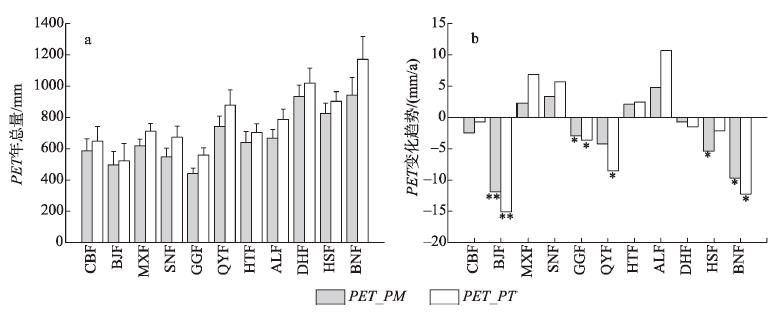
Fig. 2. Multi-year mean (a) and trends (b) of annual potential evapotranspiration at the forest sites of the Chinese Ecosystem Research Network (CERN)
Fig. 3. Contribution of meteorological factors to the trends of potential evapotranspiration at the forest sites of the Chinese Ecosystem Research Network (CERN)
Fig. 4. Comparison of PET_PM and PET_CMA in multi-year mean (a) and trends (b)
Fig. 5. Comparison of annual mean of mean temperature (a), relative humidity (b), wind speed (c), and net radiation (d) between the forest sites of the Chinese Ecosystem Research Network (CERN) and nearby China Meteorological Administration (CMA) sites
| 森林生态系统名称 | 海拔/m | 年均温/oC | 年降水/mm | 优势种 | 土壤类型 | 参考文献 |
|---|
| 长白山温带针阔混交林(CBF) | 801.00 | 3.62 | 727.93 | 蒙古栎、色木槭、红松、水曲柳 | 暗棕壤 | 文献[25] | | 北京暖温带落叶阔叶混交林(BJF) | 1263.00 | 4.80 | 530.38 | 油松、华北落叶松、辽东栎 | 棕壤 | 文献[26] | | 茂县暖温带针阔混交林(MXF) | 1826.00 | 9.30 | 825.20 | 云杉、红桦 | 棕壤 | 文献[27] | | 神农架亚热带常绿落叶阔叶混交林(SNF) | 1750.00 | 10.64 | 1456.71 | 米心水青冈、锐齿槲栎、红桦 | 黄棕壤 | 文献[28] | | 贡嘎山亚高山暗针叶林(GGF) | 3160.00 | 4.80 | 1860.50 | 峨眉冷杉、糙皮桦 | 暗棕壤 | 文献[29] | | 千烟洲亚热带人工常绿针叶林(QYF) | 100.00 | 17.90 | 1489.00 | 湿地松、杉木、马尾松 | 红壤 | 文献[30] | | 会同亚热带次生常绿阔叶林(HTF) | 700.00 | 16.47 | 1234.01 | 红栲、青冈、刨花楠 | 红壤、红黄壤 | 文献[31] | | 哀牢山亚热带湿性常绿阔叶林(ALF) | 2488.00 | 11.68 | 1728.54 | 木果石栎、多花含笑 | 黄棕壤 | 文献[32] | | 鼎湖山亚热带季风常绿阔叶林(DHF) | 290.00 | 22.25 | 1844.36 | 木荷、厚壳桂 | 赤红壤 | 文献[33] | | 鹤山亚热带人工常绿阔叶林(HSF) | 80.00 | 21.98 | 1663.71 | 马占相思 | 赤红壤 | 文献[34] | | 西双版纳热带季雨林(BNF) | 750.00 | 22.65 | 1396.70 | 番龙眼、千果榄仁 | 砖红壤 | 文献[35] |
|
Table 1. Site characteristics of 11 typical forest ecosystem research stations
| 春季 | | 夏季 | | 秋季 | | 冬季 |
|---|
| PET_PM | PET_PT | PET_PM | PET_PT | PET_PM | PET_PT | PET_PM | PET_PT |
|---|
| CBF | -1.21 | -0.60 | | -0.65 | -0.76 | | 0.06 | 0.90 | | -0.67** | -0.25** | | BJF | -1.65 | -2.70* | | -5.74** | -7.51** | | -3.71** | -4.28** | | -0.79** | -0.61** | | MXF | 0.44 | 1.76 | | 1.71 | 3.84 | | -0.47 | 0.42 | | 0.62 | 0.84 | | SNF | 0.03 | 0.46 | | 2.15 | 3.25 | | -0.31 | -0.05 | | 1.49 | 2.09 | | GGF | 0.03 | 0.06 | | -1.89* | -2.24* | | -0.77 | -1.03 | | -0.30 | -0.45 | | QYF | 0.01 | -1.36 | | -1.92 | -2.69 | | -2.28* | -3.60** | | -0.04 | -0.90 | | HTF | -0.76 | -0.72 | | 2.43 | 2.81 | | -0.16 | -0.04 | | 0.61 | 0.44 | | ALF | 2.10 | 4.26* | | 0.29 | 0.88 | | 1.97 | 3.09* | | 0.40 | 2.48* | | DHF | -0.54 | -0.74 | | 0.17 | -0.21 | | -0.65 | -0.73 | | 0.29 | 0.18 | | HSF | -2.35** | -2.33* | | -1.63 | -0.85 | | -1.06 | 0.42 | | -0.36 | 0.62 | | BNF | -2.87* | -3.57* | | -3.21* | -4.10* | | -2.27 | -2.91 | | -1.34 | -1.70 |
|
Table 2. Trends of potential evapotranspiration in different seasons at the forest sites of the Chinese Ecosystem Research Network (CERN) (mm/a)
| 大气压 | 平均气温 | 相对湿度 | 风速 | 净辐射 |
|---|
| CBF | -0.27 | 0.11 | -0.04 | 0.10 | 0.60 | | BJF | -0.23 | 0.15 | -0.03 | 0.15 | 0.62 | | MXF | -0.25 | 0.28 | -0.82 | 0.07 | 0.72 | | SNF | -0.34 | 0.25 | -0.37 | 0.02 | 0.85 | | GGF | -0.41 | 0.13 | -0.02 | -0.01 | 0.91 | | QYF | -0.25 | 0.36 | -0.04 | 0.04 | 0.83 | | HTF | -0.18 | 0.38 | -0.06 | 0.10 | 0.71 | | ALF | -0.24 | 0.33 | -1.11 | 0.04 | 0.75 | | DHF | -0.14 | 0.43 | -0.72 | 0.11 | 0.76 | | HSF | -0.14 | 0.44 | -0.07 | 0.11 | 0.76 | | BNF | -0.26 | 0.34 | -0.02 | 0.01 | 0.96 | | 平均 | -0.24 | 0.29 | -0.30 | 0.07 | 0.77 |
|
Table 3. Sensitivity of potential evapotranspiration to meteorological factors at the forest sites of the Chinese Ecosystem Research Network (CERN)
| 大气压/(kPa/a) | | 平均气温/(oC/a) | | 相对湿度/(%/a) | | 风速/(m/s/a) | | 净辐射/(MJ/m2/a) |
|---|
| CERN | CMA | CERN | CMA | CERN | CMA | CERN | CMA | CERN | CMA |
|---|
| CBF | -0.03** | 0.01** | | 0.01 | 0.03 | | -0.07 | 0.00 | | -0.05** | 0.00 | | -0.01 | -0.02* | | BJF | 0.00 | 0.00 | 0.02 | 0.03 | -0.13 | -0.12 | -0.02** | -0.04** | -0.14** | 0.00 | | MXF | 0.00 | 0.00 | 0.01 | 0.06 | 0.33* | 0.50 | -0.01 | -0.06* | 0.06 | 0.04 | | SNF | 0.01* | -0.04 | 0.06 | 0.01 | 0.38* | 0.43 | 0.01 | 0.03 | 0.05 | 0.04 | | GGF | 0.00 | 0.00 | 0.04* | 0.00 | 0.12 | 0.23 | 0.00 | -0.01* | -0.04* | 0.00 | | QYF | -0.01* | -0.01* | 0.02 | 0.02 | -0.37* | 0.17 | 0.00 | 0.01 | -0.07* | 0.00 | | HTF | 0.00 | 0.00 | 0.01 | 0.02 | -0.12 | -0.07 | -0.01 | -0.01 | 0.02 | -0.01 | | ALF | 0.00 | 0.01 | 0.03 | 0.05* | 0.24 | 0.49 | 0.01 | 0.01* | 0.09* | 0.04 | | DHF | 0.01* | -0.02** | 0.02 | -0.06** | -0.07 | 0.43* | -0.01* | 0.03 | -0.01 | 0.01 | | HSF | -0.01* | -0.02** | 0.02 | -0.03 | 0.12 | 0.13 | -0.08** | 0.00 | -0.02 | 0.03** | | BNF | 0.00 | 0.00 | 0.04* | 0.00 | -0.05 | 0.02 | -0.01** | 0.04** | -0.09* | -0.01 |
|
Table 4. Trends of meteorological factors
| 大气压 | 平均气温 | 相对湿度 | 风速 | 净辐射 |
|---|
| CBF | 0.03 | 0.22 | 0.48 | -5.32 | -0.71 | | BJF | 0.00 | 0.40 | 0.74 | -3.65 | -9.41 | | MXF | -0.01 | 0.15 | -3.65 | -0.61 | 4.30 | | SNF | -0.02 | 0.80 | -1.59 | 0.39 | 4.27 | | GGF | 0.00 | 0.55 | -0.29 | -0.02 | -3.14 | | QYF | 0.02 | 0.25 | 2.78 | 0.25 | -6.31 | | HTF | 0.00 | 0.18 | 1.32 | -0.79 | 1.37 | | ALF | 0.00 | 0.67 | -3.74 | 0.44 | 6.56 | | DHF | 0.00 | 0.46 | 1.08 | -1.23 | -1.34 | | HSF | 0.00 | 0.42 | -2.00 | -9.38 | -1.72 | | BNF | 0.00 | 0.60 | 0.17 | -1.05 | -9.92 |
|
Table 5. Contribution of meteorological factors to the trends of PET_ASCE (mm/a)
| 年均值/(MJ/m2) | | 变化趋势/(MJ/m2/a) | | 拟合的辐射系数 |
|---|
| 观测值 | 原始值 | 反推值 | 观测值 | 原始值 | 反推值 | as | bs | R2 |
|---|
| CBF | 13.42 | 12.46 | 13.62 | | -0.04 | -0.02 | -0.02 | | 0.28 | 0.53 | 0.60 | | BJF | 10.15 | 11.60 | 8.96 | -0.16 | -0.02 | -0.02 | 0.15 | 0.52 | 0.49 | | MXF | 12.04 | 12.70 | 11.92 | -0.02 | 0.01 | 0.01 | 0.18 | 0.64 | 0.86 | | SNF | 12.61 | 12.76 | 12.51 | 0.01 | -0.02 | -0.02 | 0.20 | 0.63 | 0.61 | | GGF | 9.06 | 10.95 | 8.50 | 0.08 | 0.07 | 0.10 | 0.13 | 0.72 | 0.69 | | QYF | 12.10 | 13.94 | 11.44 | -0.03 | -0.04 | -0.04 | 0.14 | 0.59 | 0.76 | | HTF | 10.79 | 11.51 | 10.51 | -0.03 | 0.03 | 0.03 | 0.20 | 0.59 | 0.63 | | ALF | 14.29 | 13.95 | 14.21 | 0.04 | 0.10 | 0.12 | 0.23 | 0.58 | 0.83 | | DHF | 13.15 | 12.78 | 12.92 | -0.02 | 0.04 | 0.05 | 0.23 | 0.59 | 0.66 | | HSF | 12.54 | 11.32 | 12.32 | -0.03 | 0.08 | 0.08 | 0.28 | 0.50 | 0.47 | | BNF | 15.41 | 15.26 | 15.46 | -0.01 | 0.01 | 0.01 | 0.26 | 0.49 | 0.68 |
|
Table 6. Fitting values of radiation coefficients of the forest sites of the Chinese Ecosystem Research Network (CERN) and the influence on calculation results of short-wave radiation