• Matter and Radiation at Extremes
  • Vol. 8, Issue 1, 018401 (2023)
Thomas Meier1、a), Dominique Laniel2, and Florian Trybel3
Author Affiliations
  • 1Center for High Pressure Science and Technology Advance Research, Beijing, China
  • 2Center for Science at Extreme Conditions, University of Edinburgh, Edinburgh, United Kingdom
  • 3Department of Physics, Chemistry and Biology (IFM), Linköping University, Linköping, Sweden
  • show less
    DOI: 10.1063/5.0119159 Cite this Article
    Thomas Meier, Dominique Laniel, Florian Trybel. Direct hydrogen quantification in high-pressure metal hydrides[J]. Matter and Radiation at Extremes, 2023, 8(1): 018401 Copy Citation Text show less
    (a) Schematic representation of the quantification method. Before laser heating, the sample cavities are filled with powder or larger crystals of the parent metal (Cu, Fe, Y, S, etc.), as well as a suitable hydrogen reservoir such as molecular hydrogen, paraffin, or ammonia–borane. The resulting proton nuclear magnetic resonance (1H-NMR) spectra contain solely signals stemming from the hydrogen-rich precursors. With thermal barriers being overcome via laser heating, hydrogen diffusion into the parent metals facilitates the formation of metal hydrides, whose 1H-NMR signal intensity (i.e., signal-to-noise ratios) is proportional to the amount of hydrogen atoms in the hydride. (b) Summary of signal intensities of all recorded 1H-NMR resonances before and after laser heating. Intensities are normalized with respect to the corresponding initial intensity of the hydrogen reservoir before laser heating. The sum of the intensities of metal hydride and remaining reservoir is equal to 1 within experimental error ranges for all samples. The system can therefore be considered as closed and the total amount of hydrogen nuclei in the DAC cavity as constant. The total deviation from 1 in percent is shown above the bars for the respective individual compounds.
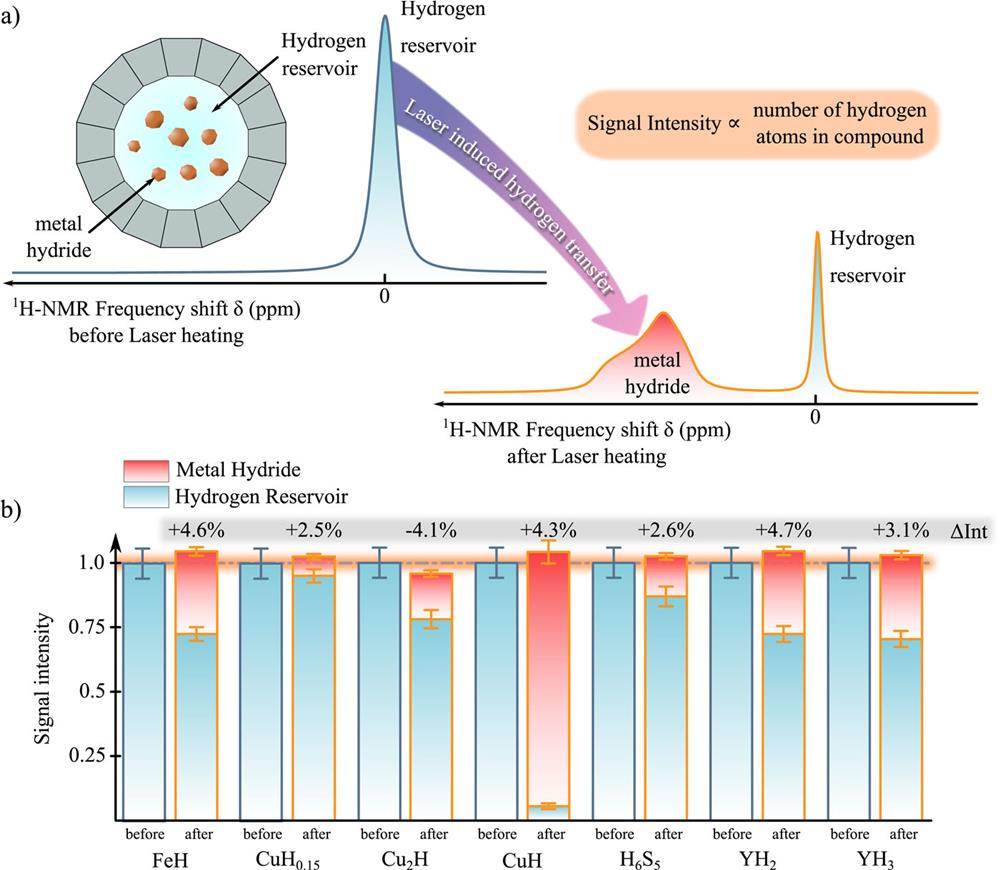
    Fig. 1. (a) Schematic representation of the quantification method. Before laser heating, the sample cavities are filled with powder or larger crystals of the parent metal (Cu, Fe, Y, S, etc.), as well as a suitable hydrogen reservoir such as molecular hydrogen, paraffin, or ammonia–borane. The resulting proton nuclear magnetic resonance (1H-NMR) spectra contain solely signals stemming from the hydrogen-rich precursors. With thermal barriers being overcome via laser heating, hydrogen diffusion into the parent metals facilitates the formation of metal hydrides, whose 1H-NMR signal intensity (i.e., signal-to-noise ratios) is proportional to the amount of hydrogen atoms in the hydride. (b) Summary of signal intensities of all recorded 1H-NMR resonances before and after laser heating. Intensities are normalized with respect to the corresponding initial intensity of the hydrogen reservoir before laser heating. The sum of the intensities of metal hydride and remaining reservoir is equal to 1 within experimental error ranges for all samples. The system can therefore be considered as closed and the total amount of hydrogen nuclei in the DAC cavity as constant. The total deviation from 1 in percent is shown above the bars for the respective individual compounds.
    139La-NMR and 1H-NMR time-domain data acquired from a commercially available sample of LaH3 under ambient conditions. Both signals at 56.6 and 400.2 MHz were acquired using a well-defined single RF pulse with sufficiently low repetition time to allow full spin relaxation. The signal intensity Vsignal in the time domain is given by the measured intensity at t = 0, and the root-mean-square noise voltage Vnoise was acquired after total signal decay.
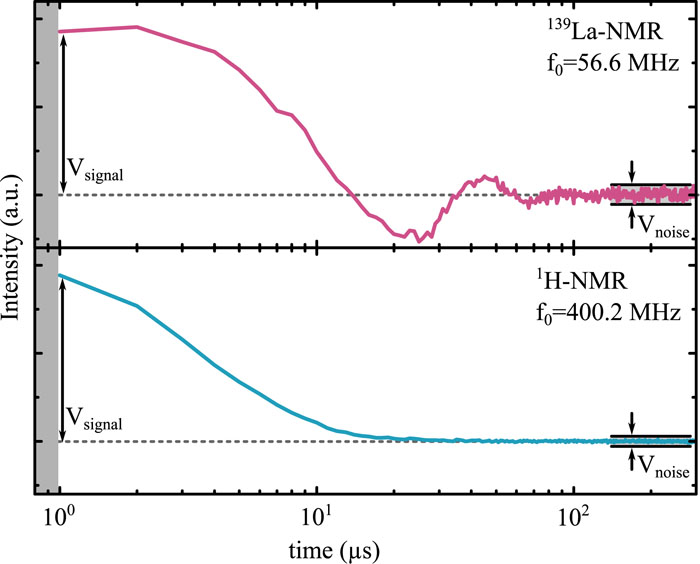
    Fig. 2. 139La-NMR and 1H-NMR time-domain data acquired from a commercially available sample of LaH3 under ambient conditions. Both signals at 56.6 and 400.2 MHz were acquired using a well-defined single RF pulse with sufficiently low repetition time to allow full spin relaxation. The signal intensity Vsignal in the time domain is given by the measured intensity at t = 0, and the root-mean-square noise voltage Vnoise was acquired after total signal decay.
    Representative 1H-NMR spectra used for quantification of the hydrogen content of metal hydrides. (a) Iron hydride. A strong additional resonance was found in the NMR spectra and was identified to be due to fcc iron hydride.28 Comparison of signal-to-noise ratios gave a hydrogen content of x = 0.95(5) H atoms per formula unit, which is close to the inferred hydrogen concentration from XRD measurements. Spectra are taken from earlier studies.28 (b) Sulfur hydride. Laser heating in the DAC was conducted at 65 GPa (blue spectrum), resulting in a weak additional signal at about −1750 ppm at 71 GPa containing ∼177 H atoms per unit cell, corresponding to a hydrogenation of x = 7.1(9) H atoms per formula unit, which is in good agreement with the tetragonal tI104 phase of H6±0.4S5 recently reported by Laniel et al.31
    Fig. 3. Representative 1H-NMR spectra used for quantification of the hydrogen content of metal hydrides. (a) Iron hydride. A strong additional resonance was found in the NMR spectra and was identified to be due to fcc iron hydride.28 Comparison of signal-to-noise ratios gave a hydrogen content of x = 0.95(5) H atoms per formula unit, which is close to the inferred hydrogen concentration from XRD measurements. Spectra are taken from earlier studies.28 (b) Sulfur hydride. Laser heating in the DAC was conducted at 65 GPa (blue spectrum), resulting in a weak additional signal at about −1750 ppm at 71 GPa containing ∼177 H atoms per unit cell, corresponding to a hydrogenation of x = 7.1(9) H atoms per formula unit, which is in good agreement with the tetragonal tI104 phase of H6±0.4S5 recently reported by Laniel et al.31
    Comparison between hydrogen content inferred from diffraction methods and that from direct measurements using NMR spectroscopy in DACs. The described method has been used to investigate several hydride systems, with hydrogen contents ranging from x = 0.15 to x = 7.1. The red dotted line is a guide to the eye of a 1:1 correlation between the two quantification methods. The structures in the background depict the low-pressure trigonal Cu2H, the face-centered cubic FeH, and the tetragonal tI140 phase of H6±0.4S5. LaH3 is not included, since the stoichiometry is known under ambient conditions and there would be a strong overlap with YH3.
    Fig. 4. Comparison between hydrogen content inferred from diffraction methods and that from direct measurements using NMR spectroscopy in DACs. The described method has been used to investigate several hydride systems, with hydrogen contents ranging from x = 0.15 to x = 7.1. The red dotted line is a guide to the eye of a 1:1 correlation between the two quantification methods. The structures in the background depict the low-pressure trigonal Cu2H, the face-centered cubic FeH, and the tetragonal tI140 phase of H6±0.4S5. LaH3 is not included, since the stoichiometry is known under ambient conditions and there would be a strong overlap with YH3.
    Thomas Meier, Dominique Laniel, Florian Trybel. Direct hydrogen quantification in high-pressure metal hydrides[J]. Matter and Radiation at Extremes, 2023, 8(1): 018401
    Download Citation