• Chinese Journal of Lasers
  • Vol. 50, Issue 21, 2107203 (2023)
Zhushanying Zhang1、2、3, Sicong Zhu1、2、3, Xianwen Zhang4, Baorong Fu5、*, Zhi Li1、2、3, Huimin Cao1、2、3、**, and Yi Liu3、6
Author Affiliations
  • 1College of Biomedical Engineering, South-Central Minzu University, Wuhan 430074, Hubei, China
  • 2Key Laboratory of Cognitive Science, State Ethnic Affairs Commission, Wuhan 430074, Hubei, China
  • 3Hubei Key Laboratory of Medical Information Analysis and Tumor Diagnosis&Treatment, Wuhan 430074, Hubei, China
  • 4Linyi GREPO Garden Machinery Co., Ltd., Linyi 276700, Shandong, China
  • 5Wuhan Great Sea Hi-Tech Co., Ltd., Wuhan 430223, Hubei, China
  • 6School of Mechanical and Electronic Engineering, Wuhan University of Technology, Wuhan 430070, Hubei, China
  • show less
    DOI: 10.3788/CJL230845 Cite this Article Set citation alerts
    Zhushanying Zhang, Sicong Zhu, Xianwen Zhang, Baorong Fu, Zhi Li, Huimin Cao, Yi Liu. Quantitative Analysis of Hemoglobin Based on SiPLS‑BP Model[J]. Chinese Journal of Lasers, 2023, 50(21): 2107203 Copy Citation Text show less
    Original spectra of imitation solution samples
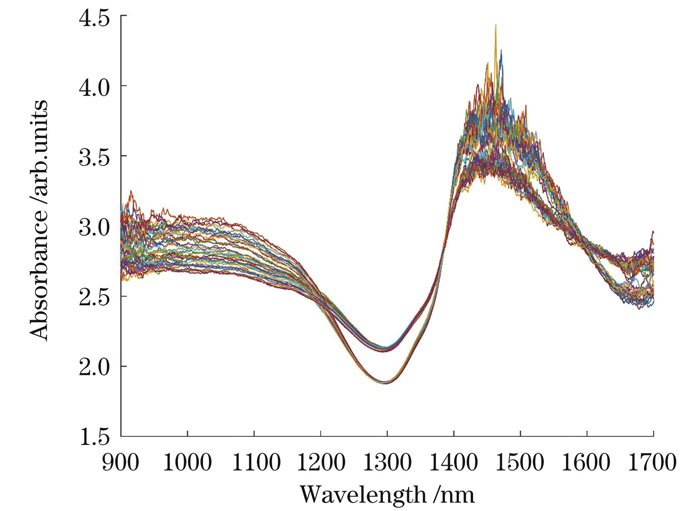
    Fig. 1. Original spectra of imitation solution samples
    Analysis of modeling results of imitation solution samples in different intervals
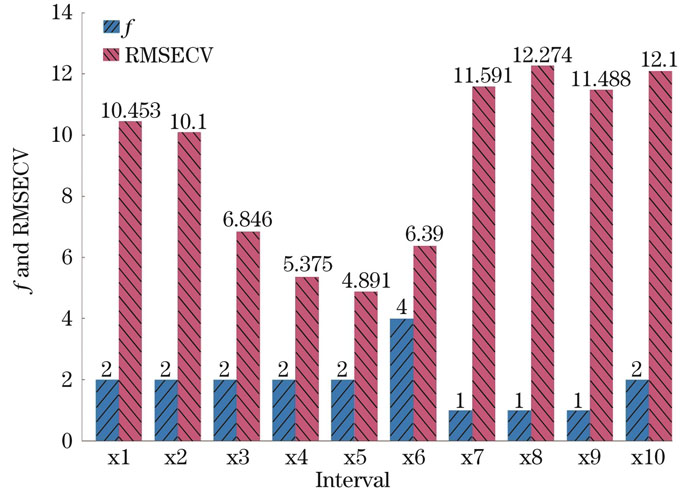
    Fig. 2. Analysis of modeling results of imitation solution samples in different intervals
    Correlation between predicted value and actual value of blood sample under BP model
    Fig. 3. Correlation between predicted value and actual value of blood sample under BP model
    Correlation between predicted value and actual value of imitation solution sample under BP model
    Fig. 4. Correlation between predicted value and actual value of imitation solution sample under BP model
    Correlation between predicted value and actual value of blood sample under SiPLS-BP model
    Fig. 5. Correlation between predicted value and actual value of blood sample under SiPLS-BP model
    Correlation between predicted value and actual value of imitation solution sample under SiPLS-BP model
    Fig. 6. Correlation between predicted value and actual value of imitation solution sample under SiPLS-BP model
    Interval No.RcRMSECRpRMSEP
    x30.79396.68380.90375.1108
    x40.86175.63690.96653.2154
    x50.88455.26620.96683.0444
    x60.86935.62040.85255.6042
    x3,x40.84725.66930.98643.3397
    x3,x50.85255.62260.97923.1272
    x3,x60.84175.9640.98342.2128
    x4,x50.86055.37420.95554.7763
    x4,x60.84395.92760.99121.8211
    x5,x60.8745.53080.99593.1854
    x3,x4,x50.85375.61720.9783.288
    x3,x4,x60.85465.81630.97022.8254
    x3,x5,x60.85575.76460.9852.2899
    x4,x5,x60.91314.50940.98072.7211
    x3,x4,x5,x60.85645.80470.9861.9894
    Full-spectrum PLS model0.88575.3670.9573.2282
    Table 1. Quantitative analysis results of optimal bands and their combinations of imitation solution samples
    ModelRcRMSECRpRMSEP
    PLS0.98972.5170.97922.746
    SiPLS0.99371.9680.98941.947
    SPA-PLS0.98802.7170.98432.376
    SiPLS-SPA-PLS0.99361.9920.99061.846
    Full-spectrum BP0.98273.3920.97423.066
    SiPLS-BP0.98652.9100.99071.807
    Table 2. Comparison of results of blood samples under different models
    ModelRcRMSECRpRMSEP
    PLS0.88575.3670.9573.228
    SiPLS0.84395.9280.99121.821
    Full-spectrum BP12.765×10-100.99151.554
    SiPLS-BP17.305×10--90.99751.017
    Table 3. Comparison of results of imitation solution samples under different models
    ModelBand range /nm
    SiPLS1100‒1298,1600‒1798,2100‒2198
    SiPLS-BP1100‒1310,1630‒1840,2054‒2370
    Table 4. Screening bands of blood samples under different models
    Zhushanying Zhang, Sicong Zhu, Xianwen Zhang, Baorong Fu, Zhi Li, Huimin Cao, Yi Liu. Quantitative Analysis of Hemoglobin Based on SiPLS‑BP Model[J]. Chinese Journal of Lasers, 2023, 50(21): 2107203
    Download Citation