• Matter and Radiation at Extremes
  • Vol. 8, Issue 1, 016901 (2023)
J. Y. Fu1, H. S. Zhang2、a), H. B. Cai2, P. L. Yao3, and S. P. Zhu2、3、4
Author Affiliations
  • 1Institute of Applied Physics and Computational Mathematics, Beijing 100088, People’s Republic of China
  • 2Laboratory of Computational Physics, Institute of Applied Physics and Computational Mathematics, Beijing 100088, People’s Republic of China
  • 3Graduate School, China Academy of Engineering Physics, P.O. Box 2101, Beijing 100088, People’s Republic of China
  • 4Science and Technology on Plasma Physics Laboratory, Laser Fusion Research Center, CAEP, Mianyang 621900, People’s Republic of China
  • show less
    DOI: 10.1063/5.0106832 Cite this Article
    J. Y. Fu, H. S. Zhang, H. B. Cai, P. L. Yao, S. P. Zhu. Effect of ablation on the nonlinear spike growth for the single-mode ablative Rayleigh–Taylor instability[J]. Matter and Radiation at Extremes, 2023, 8(1): 016901 Copy Citation Text show less
    (a) Initial equilibrium density profiles in the simulations of conventional CRTI and ARTI. (b) Dependence of the initial Atwood number AT on wave number k in the ARTI simulations.
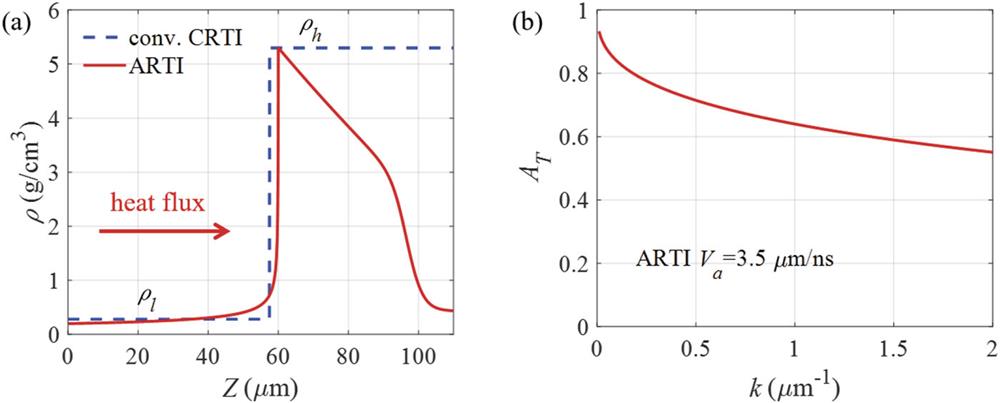
    Fig. 1. (a) Initial equilibrium density profiles in the simulations of conventional CRTI and ARTI. (b) Dependence of the initial Atwood number AT on wave number k in the ARTI simulations.
    (a) Histories of the spike velocities Vs in the conventional single-mode CRTI simulations. (b) Dependence of the spike accelerations as on AT in the reacceleration regime.
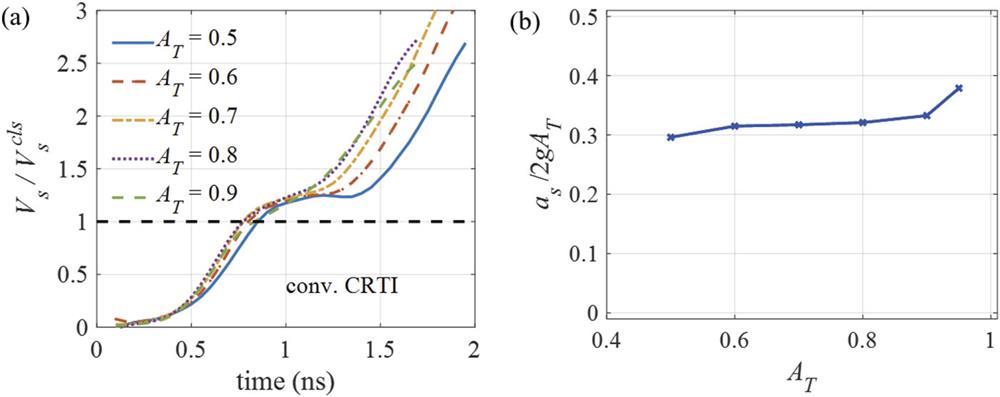
    Fig. 2. (a) Histories of the spike velocities Vs in the conventional single-mode CRTI simulations. (b) Dependence of the spike accelerations as on AT in the reacceleration regime.
    History of the spike velocity Vs from (a) the CRTI simulations with the ARTI density profile and (b) the ARTI simulations. (c) and (d) Dependences of Vsqc on k and of as on k in the CRTI simulations with the ARTI density profile, the conventional CRTI simulations, and the ARTI simulations. The dashed lines in (c) are the solutions of Eq. (2) for each case.
    Fig. 3. History of the spike velocity Vs from (a) the CRTI simulations with the ARTI density profile and (b) the ARTI simulations. (c) and (d) Dependences of Vsqc on k and of as on k in the CRTI simulations with the ARTI density profile, the conventional CRTI simulations, and the ARTI simulations. The dashed lines in (c) are the solutions of Eq. (2) for each case.
    2D vorticity ω0 structures in the spike reacceleration regime from the single-mode CRTI simulation (with ARTI density profile) and the ARTI simulation for k = 0.78 µm−1: (a) CRTI at t = 1.30 ns; (b) ARTI at t = 2.25 ns. The black regions are the high-density fluid. The black rectangular boxes indicated the areas where the volume average of the velocity shear ∂XVZ is measured. The volume average of ∂XVZ has values of ∼106.0 and ∼23.0ns−1 in (a) and (b), respectively.
    Fig. 4. 2D vorticity ω0 structures in the spike reacceleration regime from the single-mode CRTI simulation (with ARTI density profile) and the ARTI simulation for k = 0.78 µm−1: (a) CRTI at t = 1.30 ns; (b) ARTI at t = 2.25 ns. The black regions are the high-density fluid. The black rectangular boxes indicated the areas where the volume average of the velocity shear XVZ is measured. The volume average of XVZ has values of 106.0 and 23.0ns1 in (a) and (b), respectively.
    (a)–(c) Evolution of the normalized vorticity strength ω̂ at the bubble vertex in single-mode ARTI simulations (Va = 3.5 µm/ns) with different initial perturbation amplitudes Vp and wave numbers k (in μm−1). Ŵ=Wb−s/λ is the normalized mixing width. The purple lines represent the same fitting curve.
    Fig. 5. (a)–(c) Evolution of the normalized vorticity strength ω̂ at the bubble vertex in single-mode ARTI simulations (Va = 3.5 µm/ns) with different initial perturbation amplitudes Vp and wave numbers k (in μm−1). Ŵ=Wbs/λ is the normalized mixing width. The purple lines represent the same fitting curve.
    (a) Evolution of the ratio of spike to bubble penetration depths, hs/hb, in single-mode ARTI simulations with different initial perturbation amplitudes Vp. (b) and (c) Comparison of 2D vorticity structures at the same mixing width Wb−s between single-mode ARTI simulations with Vp = 4.6Va (at 1.8 ns) and 2.8Va (at 2.2 ns), respectively. The black line shows the ablation front interface.
    Fig. 6. (a) Evolution of the ratio of spike to bubble penetration depths, hs/hb, in single-mode ARTI simulations with different initial perturbation amplitudes Vp. (b) and (c) Comparison of 2D vorticity structures at the same mixing width Wbs between single-mode ARTI simulations with Vp = 4.6Va (at 1.8 ns) and 2.8Va (at 2.2 ns), respectively. The black line shows the ablation front interface.
    (a) Evolution of the vorticity at the bubble vertex in single-mode ARTI simulations with different values of the ablation velocity Va (in μm/ns). (b) Dependence of Va on the peak value of the vorticity ωpeak. The black dot-dashed line is a fitting curve.
    Fig. 7. (a) Evolution of the vorticity at the bubble vertex in single-mode ARTI simulations with different values of the ablation velocity Va (in μm/ns). (b) Dependence of Va on the peak value of the vorticity ωpeak. The black dot-dashed line is a fitting curve.
    Comparison of the evolution of the spike amplitude in conventional single-mode CRTI simulations, the present model, and Mikaelian’s model at (a) AT = 0.9 and (b) AT = 0.5.
    Fig. 8. Comparison of the evolution of the spike amplitude in conventional single-mode CRTI simulations, the present model, and Mikaelian’s model at (a) AT = 0.9 and (b) AT = 0.5.
    (a) Dependence of effective spike acceleration aeff on AT in the conventional CRTI and the ARTI simulations. The dashed lines represent the fitting curves. (b) Dependence of the fitting coefficient afit on the ablation velocity Va (in μm/ns). The red dot-dashed line is a linear fit.
    Fig. 9. (a) Dependence of effective spike acceleration aeff on AT in the conventional CRTI and the ARTI simulations. The dashed lines represent the fitting curves. (b) Dependence of the fitting coefficient afit on the ablation velocity Va (in μm/ns). The red dot-dashed line is a linear fit.
    Comparison of the evolution of the bubble and spike penetration depths hb and hs, respectively, from the single-mode ARTI simulations (with Va = 3.5 µm/ns), the present ARTI model, and the present model using the classical forms [Eqs. (5) and (7)] in the nonlinear regime at (a) k = 0.5 µm−1 and (b) k = 0.78 µm−1.
    Fig. 10. Comparison of the evolution of the bubble and spike penetration depths hb and hs, respectively, from the single-mode ARTI simulations (with Va = 3.5 µm/ns), the present ARTI model, and the present model using the classical forms [Eqs. (5) and (7)] in the nonlinear regime at (a) k = 0.5 µm−1 and (b) k = 0.78 µm−1.
    J. Y. Fu, H. S. Zhang, H. B. Cai, P. L. Yao, S. P. Zhu. Effect of ablation on the nonlinear spike growth for the single-mode ablative Rayleigh–Taylor instability[J]. Matter and Radiation at Extremes, 2023, 8(1): 016901
    Download Citation