• Chinese Optics Letters
  • Vol. 15, Issue 2, 020602 (2017)
D. Elmakias1, D. Bykhovsky1、2, and S. Arnon3、*
Author Affiliations
  • 1Electro-optical Engineering Unit, Ben-Gurion University of the Negev, Beer-Sheva, Israel
  • 2Electrical and Electronics Engineering Department, Shamoon College of Engineering, Beer-Sheva, Israel
  • 3Electrical and Computer Engineering Department, Ben-Gurion University of the Negev, Beer-Sheva, Israel
  • show less
    DOI: 10.3788/COL201715.020602 Cite this Article Set citation alerts
    D. Elmakias, D. Bykhovsky, S. Arnon. Air turbulence effects on performance of optical wireless communication with crosstalk in server backplane[J]. Chinese Optics Letters, 2017, 15(2): 020602 Copy Citation Text show less

    Abstract

    Free space optical interconnections (FSOIs) are anticipated to become a prevalent technology for short-range high-speed communication. FSOIs use lasers in board-to-board and rack-to-rack communication to achieve improved performance in next generation servers and are expected to help meet the growing demand for massive amounts of inter-card data communication. An array of transmitters and receivers arranged to create an optical bus for inter-card and card-to-backplane communication could be the solution. However, both chip heating and cooling fans produce temperature gradients and hot air flow that results in air turbulence inside the server, which induces signal fading and, hence, influences the communication performance. In addition, the proximity between neighboring transmitters and receivers in the array leads to crosstalk in the received signal, which further contributes to signal degradation. In this Letter, the primary objective is to experimentally examine the off-axis crosstalk between links in the presence of turbulence inside a server chassis. The effects of geometrical and inter-chassis turbulence characteristics are investigated and first-and second-order statistics are derived.

    Optical interconnections have become a prominent subject in free space communication research[15]. The interconnection bus technologies that are commonly used are currently copper or optical waveguide based[6]. Copper interconnections are based on electrical signals and, compared to optical interconnections, have low capacity and low immunity to electromagnetic interference[7]. Furthermore, waveguides can be directly integrated with electronics on printed circuit boards (PCBs)[8,9].

    A more recent technology used for interconnections is (reconfigurable) free space optical interconnections (FSOIs)[10], which can be applied in a variety of links, such as board-to-board, card-to-card, and between chips on-board. However, one of the drawbacks of FSOIs is that they can be significantly influenced by the air turbulence inside the server chassis. Hot and cool air currents due to the cooling fans within the server produce temperature gradients that lead to scintillation in the beam spot at the receiver[11]. Turbulence also leads to the beam wander phenomenon that affects the irradiance profile of the received signal[12,13].

    Nevertheless, FSOIs between server components are considered to offer a competitive solution for the next generation of servers due to the low index of refraction of air, which is lower than that of any waveguide, the straightforward and short distance three-dimensional (3D) arrangement capabilities, and the wide optical bandwidth facilitating high data rates with low achievable bit error rates (BERs). FSOIs operate with low data latency and can be implemented with various signal deterioration mitigation techniques[14], such as spatial and wavelength diversity[3,15,16].

    One drawback of FSOIs is related to the limitation of interconnection density. This limitation results from the inevitable diffraction effect that gives rise to the issue of interconnection crosstalk. The main goal of this Letter is to experimentally characterize this crosstalk effect and its relation to an axial optical communication channel in a typical in-chassis environment. Such characterization may contribute to furthering the effective modeling[17,18] and mitigation of the influence of crosstalk noise on communication performance. The scenario under consideration is illustrated in Fig. 1, where FSOI channels are affected by in-chassis turbulence that is generated from air cooling by fans and heat from electrical components.

    Board-to-backplane server interconnection links in the presence of crosstalk and turbulence inducing signal interference and fades.

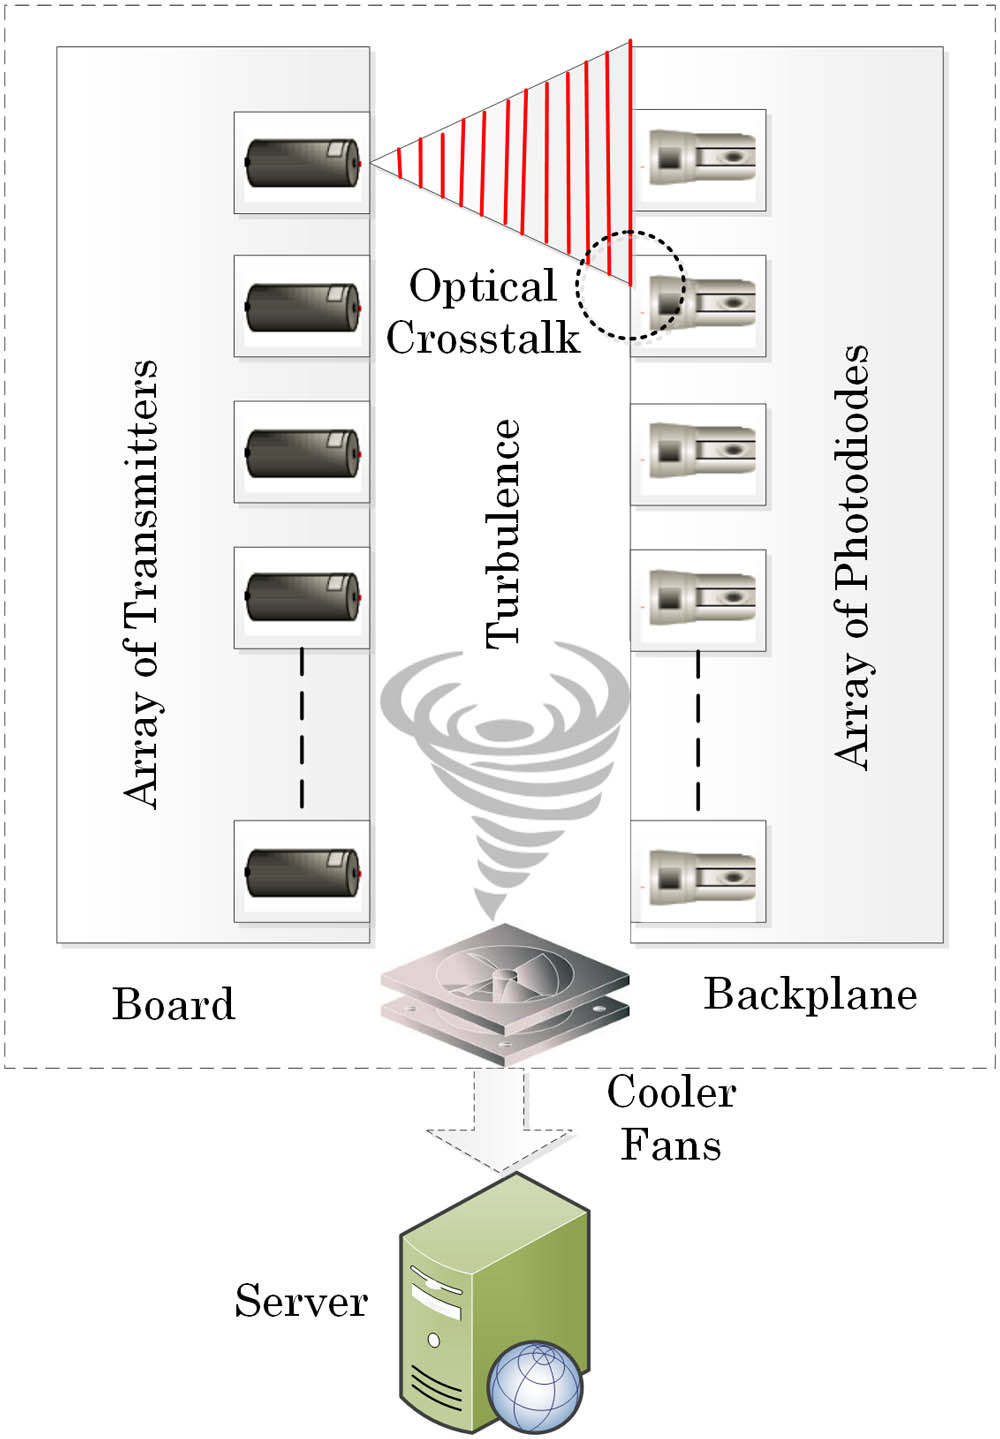
    Figure 1.Board-to-backplane server interconnection links in the presence of crosstalk and turbulence inducing signal interference and fades.

    We now review the essential theory of air turbulence and clarify its effect on communication performance. The behavior of an FSOI link may be quantified in terms of fade statistics using the probability density function (PDF) of the randomly fading signal. The lognormal PDF model often used under weak irradiance fluctuations is given by[11]fI(I)=12πIσXexp{log2(I/I)8σX2},I>0,where I is the received intensity, stands for averaging over time, and σR2=4σX2 is the Rytov variance.

    The scintillation index is a parameter that indicates the normalized intensity variance of an optical wave that is caused by atmospheric turbulence and is defined by[19]σI2=I2I21=exp(4σX2)1.

    In order to differentiate between the two cases of weak and strong irradiance fluctuation conditions, the Rytov variance is commonly used, where in the case of values σR2<1, the fluctuations are denoted as weak. The relation between the Rytov variance and the refractive index structure constant, Cn2 for the case of a plane wave, is given by σR2=1.23Cn2k7/6L11/6,where k=2π/λ is the wavenumber, λ is the wavelength, and L is the total propagation distance.

    It is convenient to express the scintillation index, σI, as a sum of independent on-axis longitudinal and off-axis radial components of the form [19, Ch. 8, Eq. (15)] σI2=σI,l2(L)+σI,r2(R),where σI,l(L) and σI,r(R) are on-axis longitudinal and off-axis radial components at distance L and radius R, respectively.

    The scintillations may be described by the normalized temporal auto-covariance function of the form [19, Sec. 8.5] bI(τ)=bI,l(τ,L)+bI,r(τ,R),where bI,l(τ,L) and bI,r(τ,R) are independent on-axis longitudinal and off-axis radial terms at distance L and radius R, respectively.

    The experiment simulates FSOI communication links within the chassis of a server (Fig. 1) and investigates the effects of ventilation of hot air. A diagram of the experimental setup is presented in Fig. 2. The resulting experimental setup is shown in Fig. 3, and details of the experimental equipment are listed in Table 1.

    Schematic diagram of experimental setup of FSO links for board-to-backplane server interconnections in the presence of air turbulence. Laser1 is on and Laser2 is off; some of the irradiance from Laser1 crosses over to photodiode PD2. The curved lines represent the airflow current from the blow heater.

    Figure 2.Schematic diagram of experimental setup of FSO links for board-to-backplane server interconnections in the presence of air turbulence. Laser1 is on and Laser2 is off; some of the irradiance from Laser1 crosses over to photodiode PD2. The curved lines represent the airflow current from the blow heater.

    Photograph of the experimental setup: (A) signal generator, (B) laser-diodes, (C) analog-to-digital (A/D) converter, (D) computer chassis, (E) anemometer, (F) photodiodes, and (G) blow-heater.

    Figure 3.Photograph of the experimental setup: (A) signal generator, (B) laser-diodes, (C) analog-to-digital (A/D) converter, (D) computer chassis, (E) anemometer, (F) photodiodes, and (G) blow-heater.

    NameManufacturerModel
    Photodiode (PD+TIA)ThorlabsPDA-10CF
    Analog-to-digital converterNINI-6210
    LasersPower TechnologyIQ1H04
    Blow heaterSachsEF-2200
    Computer chassisHPCompaq dc5750
    AnemometerLutronAM-4213

    Table 1. Equipment Used for the Experimental Setup

    The transmitter unit is composed of two continuous-wave laser modules operating at a wavelength of 1550 nm and a power of 2 mW. The laser beams propagate across the server chassis interior to the photodiodes through a turbulent channel. The collimated beams are positioned using three axis stages and mirrors, achieving approximate alignment with an inter-beam distance of 2.5 mm. The computer chassis has typical dimensions found in common servers of 0.38m×0.18m×0.43m (height, width, and depth, respectively). The total laser propagation distance is about 1.2 meters, including the chassis depth. Typical values for ambient temperature and heat flow inside the computer chassis were taken according to Ref. [3]; the temperature inside the computer chassis was up to 75°C, and the measured flow of hot air was up to 6 m/s. In our experiment, the artificial turbulence was produced by the adjustment of the blow heater settings to achieve typical in-chassis conditions. The blow heater outer diameter was 0.17 m and its power was 2000 W. The signals from the photodiodes were acquired with an analog-to-digital converter with a 16-bit resolution at a sample rate of 20 kHz. The air current speed and temperature were measured by an anemometer. The anemometer was located near the optical axis in the computer chassis. The data was logged by Labview software and analyzed off-line by Matlab.

    The environmental conditions studied are the in-chassis temperature and wind velocity, both were measured near the optical axis. The temperature as a function of the distance of the blow heater from the optical axis is presented in Fig. 4. This function may be effectively approximated by an exponential model of the form f(x)=aexp(bx)+c that is expected to characterize typical heat spreading at a roughly constant room temperature. The constant a=137.6°C reflects the maximum difference between the heater temperature and the ambient room temperature that is given by the constant c=26°C. The corresponding temperature decay coefficient is constant as b=7.8m1.

    Temperature inside the chassis as a function of the distance of the blow heater from the optical axis.

    Figure 4.Temperature inside the chassis as a function of the distance of the blow heater from the optical axis.

    Wind velocity as a function of heater distance is presented in Fig. 5 and follows similar exponential behavior of the form f(x)=aexp(bx). The wind speed decays from the starting value of a=2.4m/s to the ambient zero wind condition with a decay coefficient of b=3.0m1.

    Wind velocity as a function of the distance of the blow heater from the optical axis.

    Figure 5.Wind velocity as a function of the distance of the blow heater from the optical axis.

    The PDF of the measured laser intensity is the basis for modeling the scintillation statistics. In order to validate the weak turbulence assumption and lognormal statistics [Eq. (1)] of the crosstalk noise, the PDF was derived from measurements for different blow heater distances from the optical axis. Figure 6 illustrates the lognormal fit of the measured PDF of crosstalk noise. The results show a reasonable similarity to the general theory. The calculated scintillation index at 30 cm distance is σI(30cm)0.1 and at 80 cm distance is σI(80cm)0.07. As expected, the average signals in both cases are similar at I(30cm)I(80cm)40mV.

    Lognormal PDF; crosstalk amplitude measurements and fit for two different distances of the blow heater from the optical axis.

    Figure 6.Lognormal PDF; crosstalk amplitude measurements and fit for two different distances of the blow heater from the optical axis.

    The dependence of the scintillation index on the blow heater distances from the optical axis is presented in Fig. 7, showing the variation of on-axis channel, σI,l, and off-axis crosstalk, σI,r, values. The figure corroborates the theory that off-axis fluctuations are stronger than on-axis fluctuations due to the radial term predicted by Eq. (4). The trace resembles the exponential trendlines in Figs. 4 and 5 with an anomalous measurement at d=40cm censored. Moreover, the evaluated radial term of Eq. (4) shows similar behavior, as presented in Fig. 8.

    Measured scintillation indices of on-axis channel σI,l and off-axis crosstalk σI at different distances of the blow heater from the optical axis.

    Figure 7.Measured scintillation indices of on-axis channel σI,l and off-axis crosstalk σI at different distances of the blow heater from the optical axis.

    Measured radial term of scintillation index σI,r at different distances of the blow heater from the optical axis.

    Figure 8.Measured radial term of scintillation index σI,r at different distances of the blow heater from the optical axis.

    The channel auto-covariance was analyzed for different channel conditions, and the results are presented in Figs. 9 and 10. In order to present two plots on the same axis, both the on-axis channel and the off-axis crosstalk samples were power normalized. The resulting auto-covariance in both of the presented cases (Figs. 9 and 10) for distances of 30 and 80 cm show a general resemblance to the predictions of Eq. (5) with a notable difference between the on-axis channel and off-axis crosstalk.

    Auto-covariance of crosstalk noise at a 30 cm distance of the blow heater from the optical axis.

    Figure 9.Auto-covariance of crosstalk noise at a 30 cm distance of the blow heater from the optical axis.

    Auto-covariance of crosstalk noise at an 80 cm distance of the blow heater from the optical axis.

    Figure 10.Auto-covariance of crosstalk noise at an 80 cm distance of the blow heater from the optical axis.

    The small peak at the beginning of the crosstalk plots is due to a non-negligible amount of additive white Gaussian noise (AWGN) from different sources when compared to the relatively low power of the crosstalk term.

    The normalized cross-covariance between on-axis and crosstalk components is presented in Fig. 11. The result shows a high correlation between the on-axis signal and the off-axis crosstalk noise, as expected. The shift of the cross-covariance peak results from the off-axial radial term in Eq. (5). This term also explains the gradual increase in the shift due to the lower wind speed.

    Normalized cross-covariance between the on-axis and crosstalk components at three different distances of the blow heater from the optical axis: 30, 50, and 80 cm.

    Figure 11.Normalized cross-covariance between the on-axis and crosstalk components at three different distances of the blow heater from the optical axis: 30, 50, and 80 cm.

    To conclude, the results indicate that crosstalk noise has a significant effect on the received signal as a function of the distance of the blow heater producing the turbulence effect from the optical axis. The crosstalk noise fluctuations depend on the environmental conditions in the sense that when the temperature and the air current velocity of the turbulence increase, their effect on the received crosstalk variance increases as well.

    The empirical evaluation of turbulent-channel parameters shows some similarity between general turbulence theory and the experimental results. We find that the fading statistics follow the well-known lognormal distribution (Fig. 6). The scintillation index analysis shows a clear difference between the on-axis and off-axis indices (Figs. 7 and 8). Rigorous theoretical analysis[12,13,19] cannot be exploited to predict the experimental results due to the experimental environmental conditions that are highly uncommon when compared to common air turbulence conditions[4].

    The results of the temporal statistics shows a clear distinction between the on-axis signal and the off-axis crosstalk and their relation (Figs. 9, 10, and 11), as predicted by theory. Again, an in-depth theoretical analysis is impractical due to the above-mentioned uncommon environmental conditions.

    Taken together, these experimental results show remarkable resemblance to the general theory, notwithstanding the highly uncommon in-chassis turbulence conditions.

    References

    [1] A. F. Benner, M. Ignatowski, J. A. Kash, D. M. Kuchta, M. B. Ritter. IBM J. Res. Dev., 49, 755(2005).

    [2] R. Rachmani, A. Zilberman, S. Arnon. J. Lightwave Technol., 30, 156(2012).

    [3] R. Rachmani, S. Arnon. J. Lightwave Technol., 30, 1359(2012).

    [4] D. Bykhovsky, D. Elmakayes, S. Arnon. J. Lightwave Technol., 33, 2777(2015).

    [5] C. DeCusatis. J. Lightwave Technol., 32, 544(2014).

    [6] N. Bamiedakis, A. Hashim, R. V. Penty, I. H. White. J. Lightwave Technol., 32, 1526(2014).

    [7] I.-K. Cho, K. B. Yoon, S. H. Ahn, M. Y. Jeong, H.-K. Sung, B. H. Lee, Y. U. Heo, H.-H. Park. IEEE Photon. Technol. Lett., 16, 1754(2004).

    [8] R. Dangel, C. Berger, R. Beyeler, L. Dellmann, M. Gmur, R. Hamelin, F. Horst, T. Lamprecht, T. Morf, S. Oggioni, M. Spreafico, B. J. Offrein. IEEE Trans. Adv. Packag., 31, 759(2008).

    [9] H. Ma, A.-Y. Jen, L. Dalton. Adv. Mater., 14, 1339(2002).

    [10] K. Wang, A. Nirmalathas, C. Lim, E. Skafidas, K. Alameh. J. Lightwave Technol., 31, 1687(2013).

    [11] W. Popoola, Z. Ghassemlooy, C. Lee, A. Boucouvalas. Opt. Laser Technol., 42, 682(2010).

    [12] L. C. Andrews. Opt. Eng., 46, 086002(2007).

    [13] H. Kaushal, V. Kumar, A. Dutta, H. Aennam, V. K. Jain, S. Kar, J. Joseph. IEEE Photon. Technol. Lett., 23, 1691(2011).

    [14] H. Kaushal, G. Kaddoum. Free space optical communication: challenges and mitigation techniques(2015).

    [15] S. Navidpour, M. Uysal, M. Kavehrad. IEEE Trans. Wireless Commun., 6, 2813(2007).

    [16] Z. Ghassemlooy, W. Popoola, S. Rajbhandari. Optical Wireless Communications: System and Channel Modelling with Matlab(2012).

    [17] D. Bykhovsky. Appl. Opt., 54, 9055(2015).

    [18] D. Bykhovsky. J. Lightwave Technol., 34, 2106(2016).

    [19] L. C. Andrews, R. L. Phillips. Laser Beam Propagation Through Random Media(2005).

    D. Elmakias, D. Bykhovsky, S. Arnon. Air turbulence effects on performance of optical wireless communication with crosstalk in server backplane[J]. Chinese Optics Letters, 2017, 15(2): 020602
    Download Citation