Author Affiliations
1School of Nuclear Science and Technology, University of South China, Hengyang 421001, China2Science and Technology on Reactor System Design Technology Laboratory, Nuclear Power Institute of China, Chengdu 610213, China3Hunan Engineering & Technology Research Center for Virtual Nuclear Reactor, Hengyang 421001, Chinashow less
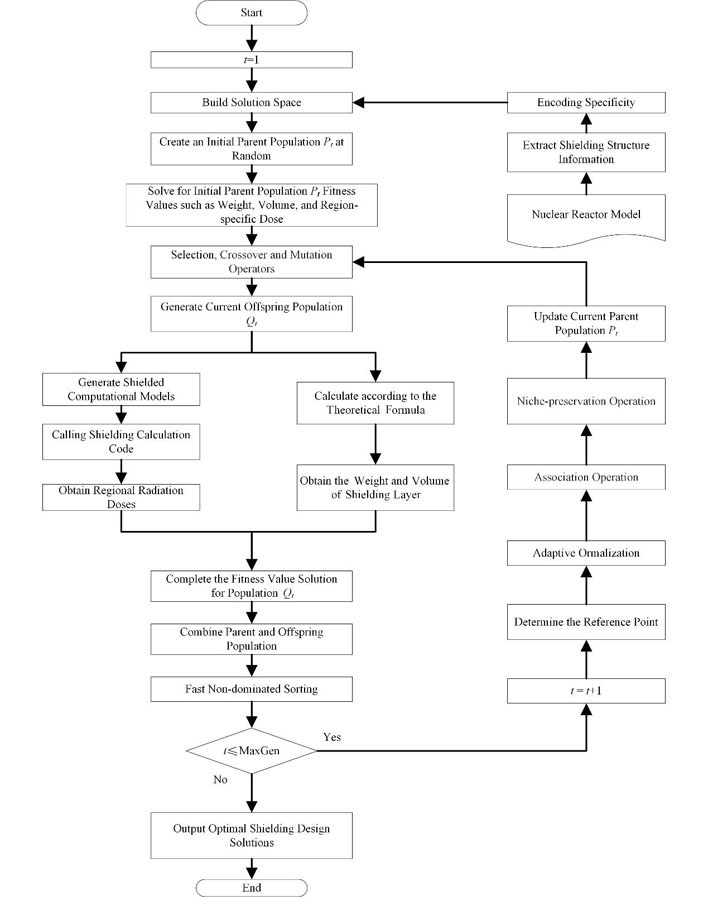
Fig. 1. Flow chart of the 3D shielding structure optimization design method
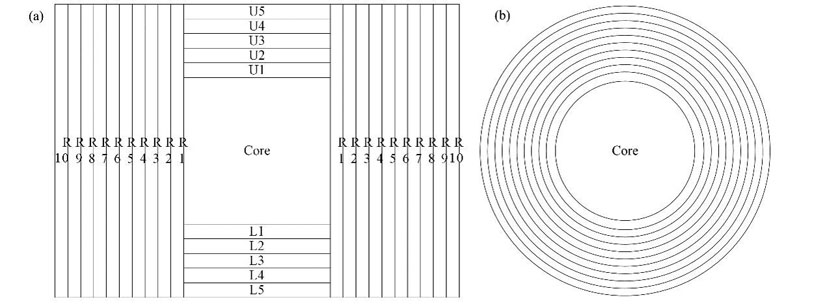
Fig. 2. Side view (a) and vertical view (b) of 3D shielding structure of nuclear reactor
Fig. 3. Flow chart of fast nondominated sorting
Fig. 4. Distribution map of 3D normalised hyperplane
Fig. 5. Schematic diagram of association operation under 3D normalised hyperplane
Fig. 6. Trend chart of frontier mean change of Pareto of objective volume (a) and weight (b)
Fig. 7. Trend chart of frontier mean change of Pareto dose rate of objective radiation dose rate of axis upper (a) and axis lower (b)
Fig. 8. Trend chart of frontier mean change of Pareto dose rate of objective radiation dose rate of radial
Fig. 9. Parallel coordinate diagram of the last population schemes under multi-objective optimization (a) and many-objective optimization (b) (color online)
Fig. 10. Schematic diagram of HV index comparison
屏蔽层序号 Shielding layer serial number | 屏蔽层位置 Shielding layer position | 屏蔽层序号 Shielding layer serial number | 屏蔽层位置 Shielding layer position |
|---|
| U1 | 轴向上第一层1st of axis upper | R1 | 径向第一层1st of radial | | U2 | 轴向上第二层2nd of axis upper | R2 | 径向第二层2nd of radial | | U3 | 轴向上第三层3rd of axis upper | R3 | 径向第三层3rd of radial | | U4 | 轴向上第四层4th of axis upper | R4 | 径向第四层4th of radial | | U5 | 轴向上第五层5th of axis upper | R5 | 径向第五层5th of radial | | L1 | 轴向下第一层1st of axis lower | R6 | 径向第六层6th of radial | | L2 | 轴向下第二层2nd of axis lower | R7 | 径向第七层7th of radial | | L3 | 轴向下第三层3rd of axis lower | R8 | 径向第八层8th of radial | | L4 | 轴向下第四层4th of axis upper | R9 | 径向第九层9th of radial | | L5 | 轴向下第五层5th of axis lower | R10 | 径向第十层10th of radial |
|
Table 1. Description of the shield number and its location
| 初始模型 Initial model | 多核并行 Multi-core parallel | 重要性减方差 Importance variance reduction | 多群输运 Multi-group transport | 本文模型 Paper model |
|---|
| 占用内存Memory occupied / MB | 49.3 | 323.5 | 49.3 | 12.4 | 47.9 | | 运算时间Computing time / s | 142 | 21 | 197 | 32 | 9 | | 剂量率计算误差Dose rate calculation error / % | 19.85 | 19.85 | 2.62 | 22.72 | 2.59 |
|
Table 2. MCNP computing resource comparison
屏蔽层号 Shelding layer No. | 厚度 Thickness / cm | 材料号 Material No. | 屏蔽层号 Shelding layer No. | 厚度 Thickness / cm | 材料号 Material No. |
|---|
| U1 | 2.5 | 8 | R1 | 0.5 | 16 | | U2 | 10.75 | 9 | R2 | 0.5 | 1 | | U3 | 0.75 | 11 | R3 | 0.25 | 17 | | U4 | 0.25 | 24 | R4 | 1 | 1 | | U5 | 1.25 | 10 | R5 | 1 | 19 | | L1 | 2.75 | 16 | R6 | 0.25 | 19 | | L2 | 0.5 | 19 | R7 | 0.25 | 7 | | L3 | 0.25 | 1 | R8 | 0.5 | 11 | | L4 | 0.5 | 11 | R9 | 3.25 | 4 | | L5 | 0.75 | 6 | R10 | 0.25 | 5 |
|
Table 3. Initial shielding design parameters for the nuclear reactor
| 序号No. | 材料名称Material type | 密度Density / g·cm-3 |
|---|
| 1 | 石墨Graphite | 2.25 | | 2 | 水Water | 1.00 | | 3 | 铍Beryllium | 1.85 | | 4 | SS307不锈钢SS307 stainless steel | 7.92 | | 5 | 铝Aluminium | 2.70 | | 6 | 铅Lead | 11.35 | | 7 | 钨Tungsten | 19.35 | | 8 | 钆Gadolinium | 7.90 | | 9 | 聚乙烯Polyethylene | 0.93 | | 10 | 硼聚乙烯Boron polyethylene | 1.22 | | 11 | 铅硼聚乙烯Aluminum-boron polyethylene | 3.60 | | 12 | 硼钢Boron steel | 7.70 | | 13 | 钨硼铝Tungsten-Boron-Aluminum | 6.10 | | 14 | 空气Air | 0.001 205 | | 15 | 碳钢Carbon steel | 7.82 | | 16 | 304不锈钢304 stainless steel | 7.92 | | 17 | 347不锈钢347 stainless steel | 7.92 | | 18 | 镍-铬-铁合金1600 Nickel-chromium-iron alloy 1600 | 8.43 | | 19 | 镍-铬-铁合金800 Nickel-chromium-iron alloy 800 | 8.01 | | 20 | 混凝土Concrete | 2.30 | | 21 | 重晶石混凝土Barite concrete | 3.35 | | 22 | 有机玻璃Organic glass | 2.30 | | 23 | 无机玻璃Inorganic glass | 2.336 | | 24 | 层布式钢纤维混凝土 Layered steel fiber reinforced concrete | 2.278 |
|
Table 4. Optional shielding material library for the optimization processes
屏蔽层号 Shelding layer No. | 87号方案 Scheme 87 | 111号方案 Scheme 111 | 149号方案 Scheme 149 | 94号方案 Scheme 94 |
|---|
厚度 Thickness / cm | 材料号 Material No. | 厚度 Thickness / cm | 材料号 Material No. | 厚度 Thickness / cm | 材料号 Material No. | 厚度 Thickness / cm | 材料号 Material No. |
|---|
| U1 | 9.5 | 10 | 8.25 | 10 | 0.75 | 10 | 3 | 6 | | U2 | 0.25 | 1 | 1.5 | 1 | 0.75 | 1 | 2.75 | 10 | | U3 | 0.25 | 23 | 4.25 | 5 | 5 | 23 | 5.75 | 11 | | U4 | 0.75 | 11 | 1.25 | 10 | 4.75 | 10 | 5 | 8 | | U5 | 2 | 3 | 3 | 11 | 8.5 | 9 | 0.75 | 9 | | L1 | 1.25 | 10 | 1.25 | 2 | 1.5 | 2 | 0.25 | 8 | | L2 | 1 | 12 | 0.25 | 10 | 1 | 10 | 0.5 | 1 | | L3 | 0.5 | 1 | 1 | 10 | 0.25 | 10 | 0.25 | 14 | | L4 | 0.75 | 3 | 0.25 | 6 | 1.5 | 2 | 4.5 | 1 | | L5 | 1 | 2 | 6.75 | 10 | 0.75 | 2 | 1 | 2 | | R1 | 0.75 | 10 | 0.25 | 10 | 0.5 | 12 | 0.5 | 11 | | R2 | 0.5 | 3 | 0.75 | 15 | 0.25 | 3 | 0.5 | 9 | | R3 | 0.75 | 10 | 1.25 | 9 | 1.25 | 2 | 0.25 | 3 | | R4 | 0.5 | 1 | 0.25 | 10 | 0.25 | 9 | 1.5 | 2 | | R5 | 1 | 10 | 0.5 | 10 | 0.5 | 10 | 0.25 | 3 | | R6 | 0.25 | 13 | 0.25 | 10 | 0.25 | 14 | 0.75 | 4 | | R7 | 0.25 | 1 | 0.25 | 1 | 0.5 | 20 | 0.25 | 19 | | R8 | 1.75 | 9 | 0.5 | 9 | 0.25 | 9 | 0.5 | 11 | | R9 | 0.25 | 14 | 0.25 | 9 | 0.5 | 9 | 0.75 | 2 | | R10 | 1 | 10 | 0.25 | 2 | 1.75 | 10 | 0.25 | 8 | | 体积Volume / cm3 | 1.005 6×10⁶ | 9.890 0×105 | 1.076 0×106 | 1.002 6×10⁶ | | 重量Weight / g | 1.578 0×106 | 1.987 8×10⁶ | 1.665 1×10⁶ | 3.887 2×10⁶ | | 轴向上方剂量率 Radiation dose rate of axis upper / Sv·h-1 | 7.638 7×10-14 | 3.953 9×10-14 | 3.550 9×10-14 | 7.346 1×10-14 | | 轴向下方剂量率Radiation dose rate of axis lower / Sv·h-1 | 6.590 0×10-13 | 1.427 7×10-13 | 5.248 6×10-12 | 6.948 1×10-13 | 径向侧面剂量率 Radiation dose rate of radial / Sv·h-1 | 3.061 6×10-13 | 5.502 1×10-13 | 4.103 1×10-13 | 5.704 8×10-13 |
|
Table 5. Detailed design parameters and target values for the better scheme
相对优化比例 Relative optimization ratio | 体积 Volume / cm3 | 重量 Weight / g | 轴向上方剂量率 Radiation dose rate of axis upper / Sv·h-1 | 轴向下方剂量率 Radiation dose rate of axis lower / Sv·h-1 | 径向侧面剂量率 Radiation dose rate of radial / Sv·h-1 |
|---|
| 原方案Original scheme | 1.151 3×10⁶ | 6.517 9×10⁶ | 7.811 4×10-14 | 9.848 5×10-13 | 6.667 9×10-13 | | 87方案Scheme 87 | 12.66 | 75.79 | 2.21 | 33.09 | 54.08 | | 111方案Scheme 111 | 14.10 | 69.50 | 49.38 | 85.50 | 17.48 | | 149方案Scheme 149 | 6.54 | 74.45 | 54.54 | 94.67 | 38.47 | | 94方案Scheme 94 | 12.92 | 40.36 | 5.96 | 29.45 | 14.44 |
|
Table 6. Initial scheme target values and relative optimization ratios for each optimized scheme (%)