• Journal of Geographical Sciences
  • Vol. 30, Issue 4, 621 (2020)
Wenjie YANG1, Qianwen GONG1、2、*, and Xueyan ZHANG3、4
Author Affiliations
  • 1Center for Green Development and Chinese Rural Land Research, Beijing Forestry University, Beijing 100083, China
  • 2School of Marxism, Beijing Forestry University, Beijing 100083, China
  • 3Institute of Geographic Sciences and Natural Resources Research, CAS, Beijing 100101, China
  • 4Center for Chinese Agricultural Policy, CAS, Beijing 100101, China
  • show less
    DOI: 10.1007/s11442-020-1746-3 Cite this Article
    Wenjie YANG, Qianwen GONG, Xueyan ZHANG. Surplus or deficit? Quantifying the total ecological compensation of Beijing-Tianjin-Hebei Region[J]. Journal of Geographical Sciences, 2020, 30(4): 621 Copy Citation Text show less
    DEM and ecological function zoning of the regionSource: DEM 90 m data and Chinese ecological function zoning data were derived from the Data Center for Resources and Environmental Sciences of CAS.Notes: Windbreak and sand fixation is the ecological function zone at northern foot of the Yinshan Mountain-Hunshandake Sandy Land. Soil conservation is the ecological function zone of the Taihang Mountains. Water source conservation A is the ecological function zone for West Liaohe River source conservation. Water source conservation B is the ecological function zone for Beijing-Tianjin water source conservation.
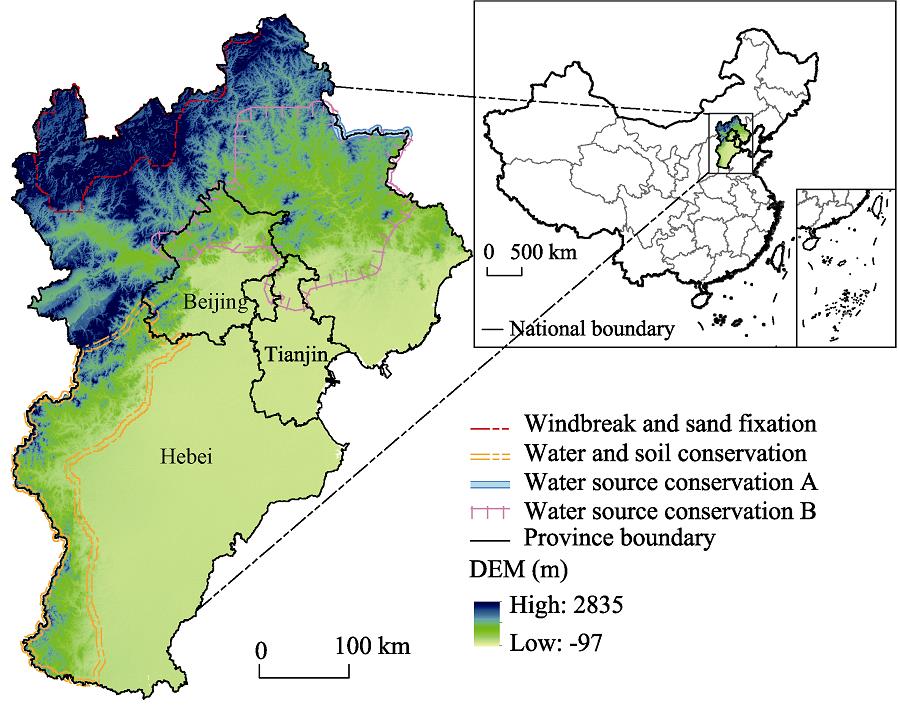
    Fig. 1. DEM and ecological function zoning of the regionSource: DEM 90 m data and Chinese ecological function zoning data were derived from the Data Center for Resources and Environmental Sciences of CAS.Notes: Windbreak and sand fixation is the ecological function zone at northern foot of the Yinshan Mountain-Hunshandake Sandy Land. Soil conservation is the ecological function zone of the Taihang Mountains. Water source conservation A is the ecological function zone for West Liaohe River source conservation. Water source conservation B is the ecological function zone for Beijing-Tianjin water source conservation.
    Distribution map of average value of ecological assets for different ecosystem types in 2015
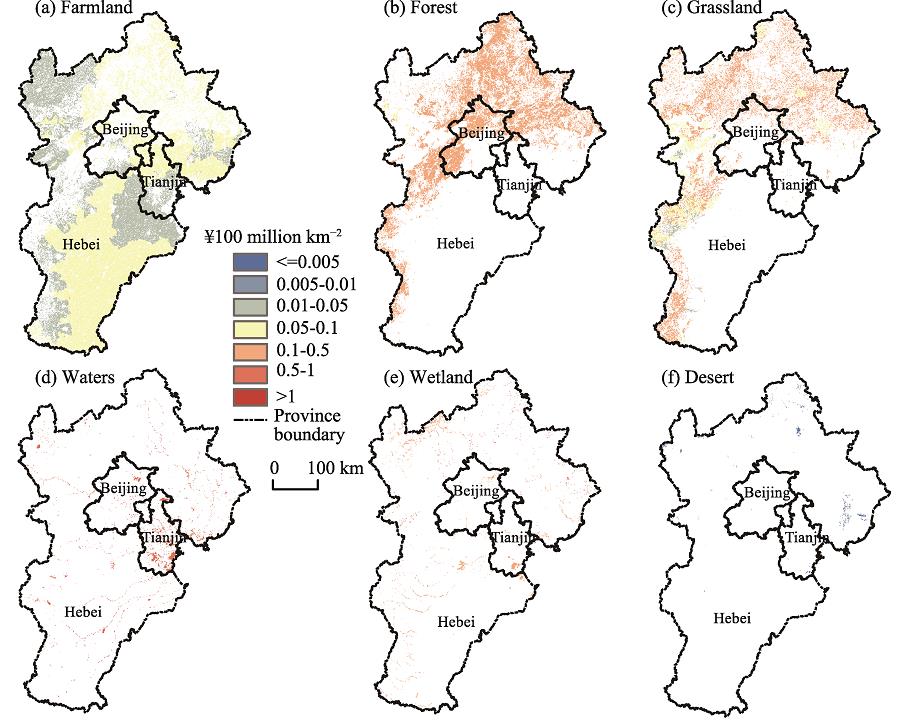
    Fig. 2. Distribution map of average value of ecological assets for different ecosystem types in 2015
    Total ecological compensation of the region in different periodsNotes: Constant price of all data were calculated based on the year 2000
    Fig. 3. Total ecological compensation of the region in different periodsNotes: Constant price of all data were calculated based on the year 2000
    Spatial distribution maps of average ecological compensation among the counties in the regionNotes: Constant price of all data were calculated based on the year 2000.
    Fig. 4. Spatial distribution maps of average ecological compensation among the counties in the regionNotes: Constant price of all data were calculated based on the year 2000.
    The share of ecological surplus areas at county level in the region in different periods
    Fig. 5. The share of ecological surplus areas at county level in the region in different periods
    Spatiotemporal change distribution of ecological deficit and surplus areas in the region
    Fig. 6. Spatiotemporal change distribution of ecological deficit and surplus areas in the region
    Ecosystem typesSupply serviceRegulation serviceSupport serviceCultural service
    Primary classificationSecondary classificationFPRMPWSARCREPHRSCNCMBDAL
    FarmlandDry land0.850.400.020.670.360.100.271.030.120.130.06
    Paddy field1.360.09-2.631.110.570.172.720.010.190.210.09
    ForestWoodland0.310.710.372.357.031.993.512.860.222.601.14
    Sparse shrubbery0.190.430.221.414.231.283.351.720.131.570.69
    GrasslandHigh coverage grassland0.380.560.311.975.211.723.822.400.182.180.96
    Moderate coverage grassland0.220.330.181.143.021.002.211.390.111.270.56
    Low coverage grassland0.100.140.080.511.340.440.980.620.050.560.25
    WatersCanal, lake, reservoir0.800.238.290.772.295.55102.240.930.072.551.89
    WetlandMud flat, bottom land, marsh0.510.502.591.903.603.6024.232.310.187.874.73
    DesertSandy land, saline-alkali soil0.010.030.020.110.100.310.210.130.010.120.05
    Bare soil, bare rock0.000.000.000.020.000.100.030.020.000.020.01
    Table 1.

    Unit area ecosystem service value equivalent scale

    Ecosystem types20002005Growth rate (%)2010Growth rate (%)2015Growth rate (%)
    Farmland68.67163.16137.60229.6940.78464.11102.06
    Forest241.82553.21128.77814.6247.25823.141.05
    Grassland101.99235.30130.71357.5151.94423.8718.56
    Waters77.73171.64120.82253.0147.41259.262.47
    Wetland26.3158.73123.2289.5452.46103.3715.45
    Desert0.120.28133.330.4250.000.39-7.14
    Total (unchanged price in 2000)516.641182.32128.851744.7947.572074.1418.88
    Table 2.

    Changes in ecological assets of different ecosystem types each period (billion yuan)

    Service type2000200520102015
    ValueContribution (%)ValueContribution (%)ValueContribution (%)ValueContribution (%)
    Food production22.894.4356.475.0480.044.19160.3724.39
    Raw material production17.293.3542.163.7461.483.43101.1012.03
    Water supply10.592.0517.841.0927.181.6627.800.19
    Gas regulation46.579.01111.869.81165.029.45245.3324.38
    Climate regulation101.2819.60240.0820.85360.6721.44446.6026.09
    Environment purification33.716.5280.717.06120.527.08149.738.87
    Hydrological regulation139.1026.92283.9321.76426.3325.32422.38-1.20
    Soil conservation77.6815.04187.9316.56262.3213.23210.75-15.66
    Nutrients cyclemaintenance5.521.0713.361.1819.461.0832.093.83
    Biodiversity42.398.20101.048.81151.538.98189.6511.57
    Aesthetic landscape19.643.8046.944.1070.244.1488.335.49
    Total (unchanged price in 2000)516.64100.001182.32100.001744.79100.002074.14100.00
    Table 3.

    Changes in the value of regional ecosystem services and their contribution in different periods (¥ billion)

    Wenjie YANG, Qianwen GONG, Xueyan ZHANG. Surplus or deficit? Quantifying the total ecological compensation of Beijing-Tianjin-Hebei Region[J]. Journal of Geographical Sciences, 2020, 30(4): 621
    Download Citation