
Wulong Zhao, Hongjun Liu, Qibing Sun, Nan Huang, Zhaolu Wang, Jing Han, Heng Sun. Extracting signal via stochastic resonance in the semiconductor optical amplifier[J]. Chinese Optics Letters, 2016, 14(8): 081901
- Chinese Optics Letters
- Vol. 14, Issue 8, 081901 (2016)
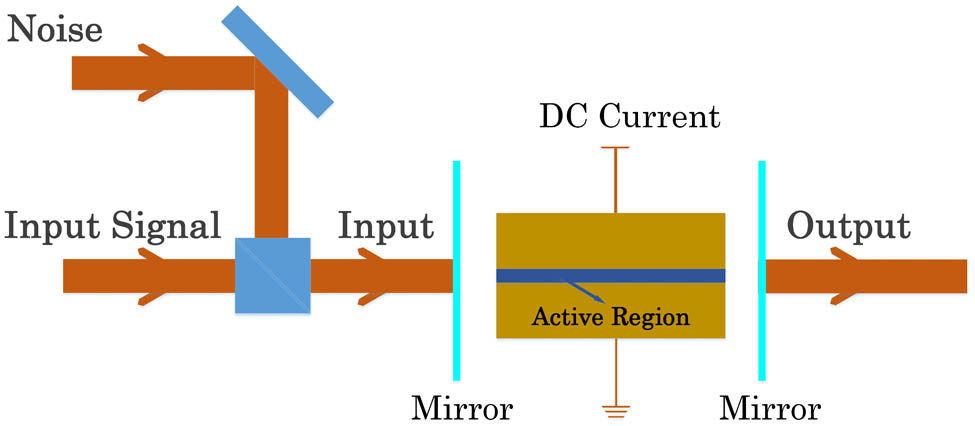
Fig. 1. Schematic diagram of the stochastic resonance system.
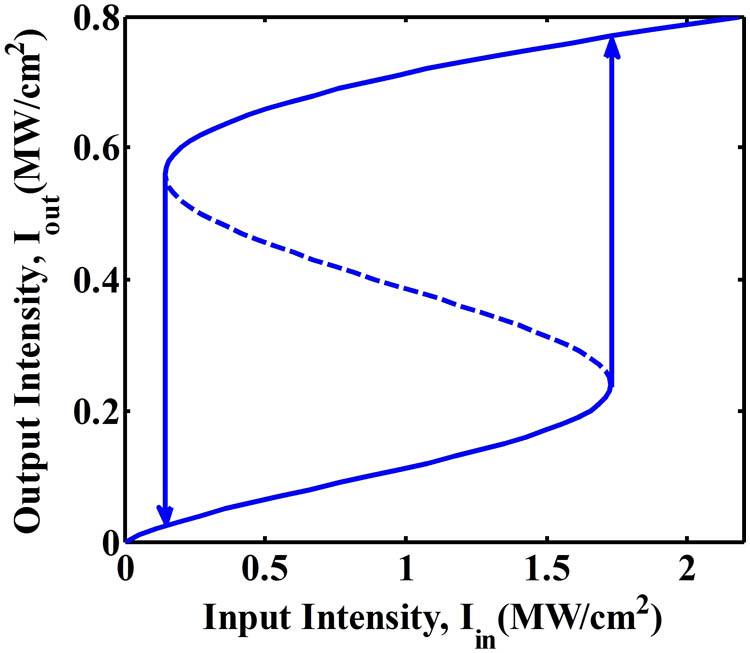
Fig. 2. Optical bistable hysteresis in the SOA with α = 20 cm − 1 η = 0.75 g 0 = 280 cm − 1 L = 300 μm b = 2 φ 0 = π 4 R = 0.3
Fig. 3. Bistable output characteristics with different system parameters of the SOA: (a) b = 3 φ 0 = π 4 R = 0.3 L = 100 μm L = 300 μm b = 3 φ 0 = π 4 R = 0.1
Fig. 4. Bistability characteristics with different parameters: (a) R = 0.3 L = 300 μm b = 3 φ 0 = 0 π 4 π 3 π 2 R = 0.3 L = 300 μm φ 0 = π 4 b = 1.5
Fig. 5. Transmission properties of the stochastic resonance system with increasing noise intensities. (a)–(d) input signals S 0 = 0.5 MW / cm 2 D 0 ∶ 1 1 ∶ 1 5 ∶ 1 10 ∶ 1 L = 300 μm R = 0.3 φ 0 = π 4 b = 3
Fig. 6. (a) Cross-correlation coefficients and (b) the cross-correlation gain as functions of the normalized noise intensity D L = 300 μm R = 0.3 φ 0 = π 4 b = 3

Set citation alerts for the article
Please enter your email address
© Copyright 2018-2021 | Chinese Laser Press. All Rights Reserved 沪ICP备15018463号-20