Abstract
A differential phase extracting method based on self-copy-shift for distributed acoustic sensing is proposed. Heterodyne and optical hybrids are used to realize high signal-to-noise ratio in-phase and quadrature-phase (IQ) signal measurement. The measured signals are self-copied and shifted for certain data points, and then they are digitally mixed with the original signals to construct the differential phase. The four produced signals are then combined to carry out IQ demodulation. An experiment with strain having an amplitude modulation waveform is carried out. The results showed that waveform information can be recovered well, and the signal-to-noise ratio achieves 32.8 dB.The fiber distributed acoustic sensing (DAS) system has wide applications on building structure health monitoring[1–4], subsurface mineral exploration[5], seismic waves measurements[6–10], and so on. Phase-sensitive optical time domain reflectometry (OTDR) based on fiber Rayleigh backscattering (RBS) light is a common configuration for fiber DAS, and the quantitative phase extraction process plays an important role in providing a linear waveform recovery response[11,12].
Differential phase is related to a section, which is defined by two points at a distance on the sensing fiber, and varies linearly with the strain. Differential phase can be calculated by direct subtraction with phase at two points; however, the value is easily deteriorated by phase extraction noise. Some differential phase extraction schemes for OTDR-based DAS have been proposed. Masoudi and Newson constructed an unbalanced Michelson interferometer with a fiber coupler. Thus, the differential phase is detected between two RBS lights at two locations on the sensing fiber[13,14]. Alekseev et al. proposed a single pulse probe detection method with the differential phase-shift keying technique. The three probes are designed to have a phase difference between the front and back halves. The phase difference of the three probes is delayed by a relative phase shift in sequence to emulate phase diversity demodulation. They need to synchronize the intensity modulator and phase modulator carefully, and its measurement bandwidth is reduced by 2/3[15]. Compared with homodyne detection, the heterodyne detection scheme can avoid possible low frequency noise by shifting frequency. Alekseev et al. improved their previous scheme by using probe double pulses with different carrier frequencies and a time delay between the pulses[16]. He et al. proposed a similar setup, but with two acoustic-optic modulators (AOMs)[17]. Muanenda et al. used a single AOM and a delay fiber to generate double pulses. The phase generated carrier technique was utilized for providing carrier waves to the interference light signal containing differential phases[18]. Shan et al. combined a double pulse with an ultra-weak fiber Bragg grating (UWFBG) pair to detect the differential phase[19]. However, the section length or spatial resolution is fixed by the optical path difference of the Michelson interferometer, delay fiber, or time delay of pulses, which reduces the system flexibility. Besides, optical coherent amplification is proposed by Lu et al. for increasing the signal-to-noise ratio (SNR) of the optical signal[20]. But, the coherent detection introduces noise caused by the perturbance on the locational reference fiber and the frequency drift of the light source. Liu et al. calculated the difference value of the extracted phase of the coherent OTDR signal to reduce the noise introduced by coherent detection[21]. However, the fading part of the coherent signal leads to violent perturbance of phase, which accumulates with distance, which can be circumvented to some extent by constructing differential phases before extracting phases.
In this Letter, a new differential phase extracting method based on self-copy-shift and in-phase/quadrature-phase (I/Q) demodulation is proposed. We utilize coherent detection to increase the intensity of the signal. A dual-parallel Mach–Zehnder modulator (DPMZM) is used to generate a pulse signal with frequency shift, and a 90 deg optical hybrid is used for IQ demodulation. The measured signals are self-copied and shifted for certain data points, and then they are digitally mixed with the original signals to construct and extract the differential phase to eliminate common mode noise caused by the perturbance on the locational reference fiber and light source frequency drift. A 10 m long optical fiber wrapped on piezoelectric ceramics (PZT) is utilized for simulating the strain caused by the acoustic signal action on the sensing fiber. A modulated signal with amplitude triangle envelopment modulation is loaded on the PZT. The experiment results showed that the applied modulation signal waveform is recovered well. An SNR achieves 32.8 dB when a triangle-amplitude-modulated sinusoidal signal with the maximum amplitude of 1 V is loaded.
Sign up for Chinese Optics Letters TOC. Get the latest issue of Chinese Optics Letters delivered right to you!Sign up now
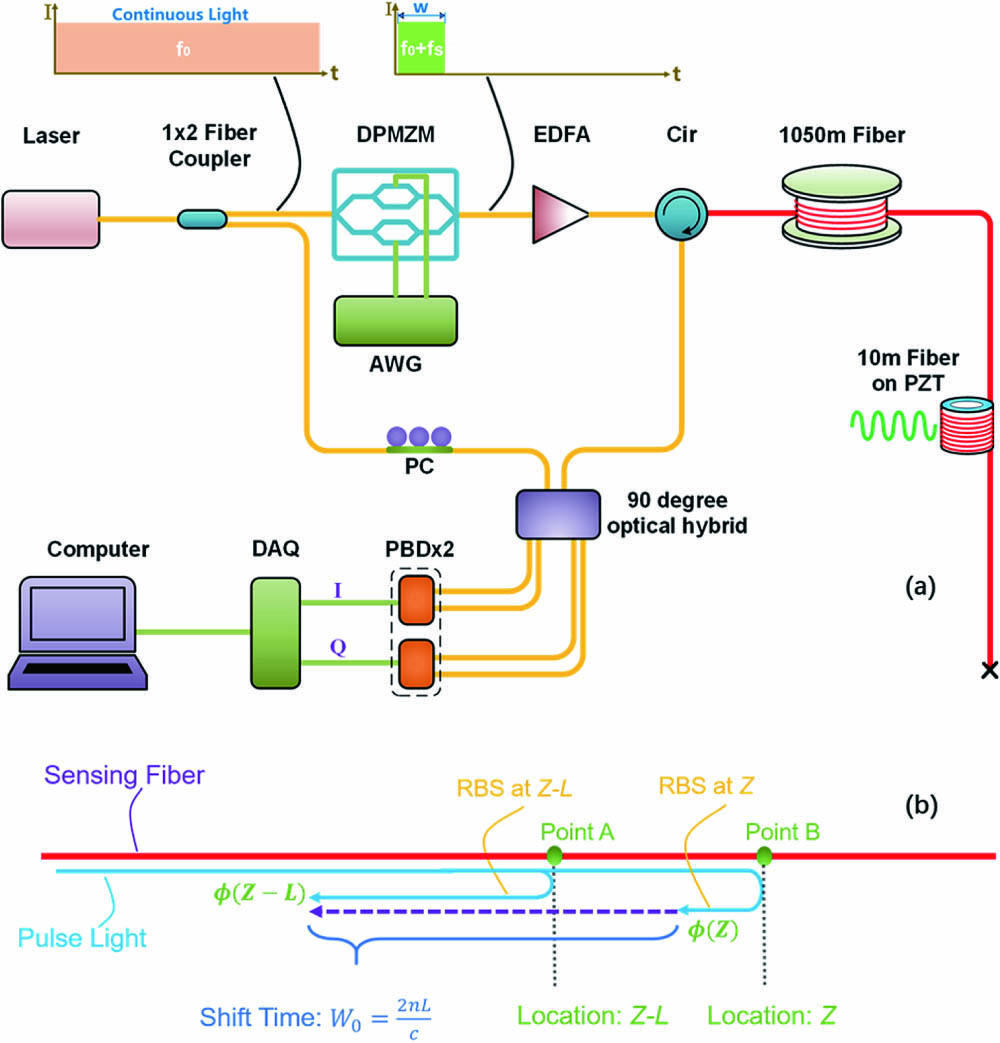
The proposed sensing system diagram is shown in Fig. 1(a). The light with an optical frequency of from a narrowband continuous wave (CW) laser goes through a fiber coupler. The continuous incident light is divided into the local reference light for coherent receiving and the signal light for generating the pulse light signal. The local reference light goes through a polarization controller and enters the 90 deg optical hybrid. The signal light goes into the DPMZM. It is modulated into a pulse signal by the DPMZM. An arbitrary waveform generator (AWG) is used for driving the DPMZM. The voltage signals of the two channels can be expressed as where is the voltage amplitude of the driving signal, which needs to be much less than the half-wave voltage of the DPMZM for linear modulation[22–24]. The width of the generated pulse light is , and the light frequency of the generated pulse light is shifted to , while the pulse repeat period is , as shown in Fig. 1(a).

Figure 1.(a) Scheme of self-copy-shift-based differential phase coherent OTDR system. (b) Scheme diagram of digital shift time calculating.
The pulse signal is amplified by the erbium-doped fiber amplifier (EDFA). Then, the amplified pulse signal is injected into the sensing fiber through the fiber circulator. When the pulse signal is transmitting in the sensing fiber, the RBS light is generated at each scattering point in the fiber. The generated RBS light carrying phase information of each sensing fiber section comes back along the sensing fiber, goes through the circulator, and interferes with the local reference light in the 90 deg optical hybrid. The interference light signals are received by two photoelectric balance detectors (PBDs) and transformed into electronical signals. The direct-current (DC) component of the interference signals is discarded by PBDs, and the alternating component is sent to the data acquisition (DAQ) card. The collected data is transmitted to the computer and processed.
The orthogonal signals output from the two PBDs after the 90 deg optical hybrid can be expressed as where is the carrier frequency of the coherent signals, and it is equal to the shift frequency of the modulated optical pulse; is the amplitude of the coherent signal, which is also the envelope curve of the coherent signal; is the phase corresponding to the position on the sensing fiber, as shown in Fig. 1(b); is the phase of the local reference light.
Figure 2 shows the demodulation procedure. The signals and go through time shift, respectively, and the output results and are where is the shift time; is the phase corresponding to the position on the sensing fiber. As shown in Fig. 1(b), is the time for the light signal’s round trip in an long optical fiber. Thus, is corresponding to the shift time and satisfies the equation . is the speed of light in vacuum; is the fiber refractive index. When encountering the signal around a fading area, the shift time needs to be temporarily adjusted to the space between the two nearest high-quality areas on either side of the fading area and set Z and Z – L to correspond to the two high-quality areas, respectively.
Figure 2.Diagram of phase demodulation algorithm.
The signals and are mixed with and , respectively. The results can be simply written as where and . Then, the four signals are further processed, as shown in Fig. 3. The signals and are added, while the signals and are subtracted. According to the trigonometric function difference formula, the expressions of the two results and can be simplified to where is the differential phase; is a constant. is extracted by finding the angle of complex number and minus . As shown in Fig. 1(b), the phase information of the RBS generated at point A and point B is and , respectively. Thus, the differential phase is corresponding to the distance and the refractive index of the fiber between point A and point B.
Figure 3.(a) Three-dimensional (3D) plot of spatial-temporal domain retrieved result of AM signal. (b) The retrieved waveform temporal domain curve at 1050 m from 0 to 120 ms. (c) The partial enlargement graph of the temporal domain curve at 1050 m from 15 to 60 ms. (d) Power spectral density (PSD) of the recovered signal.
When strain induced by an acoustic event is applied to the fiber between point A and point B, tiny changes in fiber length and fiber refractive index are introduced. The differential phase variation is proportional to the strain by where is the material Poisson’s ratio; and are elements of elastic-optic coefficient matrix. According to Eq. (13), the differential phase variation is directly and only proportional to the strain applied to the corresponding section of sensing fiber. Therefore, the acoustic waveform acting on the sensing fiber can be retrieved by extracting and monitoring the differential phase variation along the sensing fiber.
We established an experimental setup according to Fig. 1(a). A narrowband laser with a linewidth less than 3 kHz generated CW light with 1550.12 nm center wavelength and 40 mW power. The DPMZM (Photoline MXIQ-LN-40) has a sharp rise edge, whose rise time is less than 25 ps, and it is driven by the dual-channel AWG (AT-AWG-GS2500) with 14 bit vertical resolution, 2.5 GS/s sampling rate, and time domain deviation between channels less than 10 ps. The generated pulse pair shifted frequency is . The pulse width is , while the pulse repeat period is . Thus, the acoustic signal acting on the distributed sensing fiber is detected with 40 kHz sampling rate. A 10 m fiber wrapped on a PZT is utilized for simulating the strain perturbation caused by an acoustic field waveform acting on the sensing fiber. This 10 m fiber is connected to the end of a 1050 m optical fiber. A function waveform generator (Aglient 33521A) generated voltage signals to drive the PZT. The working frequency range of the BPDs is from 30 kHz to 150 MHz, and the data is sampled by a two-channel DAQ card with 1 GS/s sampling rate and 12 bit resolution for each channel.
In order to verify the acoustic signal retrieval ability, an amplitude modulation (AM) simulated acoustic signal is applied to the 10 m long sensing fiber by driving the PZT with the corresponding voltage signal. The carrier signal is a sinusoidal signal, while the AM signal is a triangular wave. The frequency of the sinusoidal carrier signal is fixed at , while the amplitude is fixed at 1000 mV. The frequency of the triangular-wave AM signal is , while the AM ratio is 0%–100%, which changes the waveform amplitude from 0 mV to 1000 mV linearly. Figure 3(a) showed the spatial-temporal domain retrieving result after median filter processing. An AM sinusoid waveform can be recognized at 1050 m, which is consistent with the actual location of the stretched sensing fiber. The location information and the waveform of the signal are detected correctly. The time domain signal at the location of 1050 m is shown in Fig. 3(b), the orange asterisk shaped scatters are the demodulated results, and the blue curve is the fitting curve of the retrieved waveform. The waveform is recovered well with the fitting R-squared value of 0.9863. The partial enlargement graph in Fig. 3(c) shows more directly that the retrieved signal waveform has little distortion.
Figure 3(d) is the power spectral density of the recovered signal. The center frequency is 500 Hz, while the frequencies of the two nearest spectrum lines are 475 Hz and 525 Hz. Four other lines symmetrically existing beside the center spectrum have the frequencies of 375 Hz, 425 Hz, 575 Hz, and 625 Hz. These frequencies are consistent with the frequency spectrum characteristic of the loaded triangular-wave AM sinusoid waveform. These intensity characteristics of spectral lines are also consistent with the measured results shown in Fig. 3(d). The measured spectrum also contains a spectrum component 32.8 dB lower than the center line signal with the frequency of 1000 Hz, which is the double frequency signal of the carrier signal produced slightly outranging. This double frequency noise signal also mixes with the triangle signal to produce the signals with frequencies of 975 Hz and 1025 Hz, respectively. The higher-order signals are drowned in random broadband noise.
In conclusion, a differential phase extracting method for fiber DAS based on digital shift and IQ demodulation is proposed and demonstrated. We use a DPMZM to generate pulse light with shift frequency. The 90 deg optical hybrid is utilized for producing phase shift and coherently amplifying the RBS signal. The proposed scheme not only brings the advantage of coherent detection into play, but also constructs differential phase with a digital shift and demodulation algorithm to suppress the noise caused by phase drift and vibration on the local reference fiber, which is one of the main problems that trouble traditional coherent OTDR systems. A sinusoidal signal modulated by a triangular wave is used for system performance investigation. The experimental results showed that the simulated acoustic signal information containing time domain waveform and spectrum characters can be recovered well. Besides, the digital shift algorithm can provide a flexible spatial resolution for different application requirements.
References
[1] Y. Bao, H. Li, J. Ou. J. Civ. Struct. Heal. Monit., 4, 77(2014).
[2] A. Güemes, A. Fernández-López, P. F. Díaz-Maroto, A. Lozano, J. Sierra-Perez. Sensors, 18, 1094(2018).
[3] S. Liang, C. Zhang, W. Lin, L. Li, C. Li, X. Feng, B. Lin. Opt. Lett., 34, 1858(2009).
[4] A. Reza, F. Maasoumi. Opt. Fiber Technol., 16, 240(2010).
[5] A. Bona, R. Pevzner. ASEG Ext. Abstr., 2018, 1(2018).
[6] A. Hartog, B. Frignet, D. Mackie, M. Clark. Geophys. Prospect., 62, 693(2014).
[7] K. N. Madsen, M. Thompson, T. Parker, D. Finfer. First Break, 31, 51(2013).
[8] N. J. Lindsey, E. R. Martin, D. S. Dreger, B. Freifeld, S. Cole, S. R. James, B. L. Biondi, J. B. Ajo-Franklin. Geophys. Res. Lett., 44, 11792(2017).
[9] T. Reinsch, P. Jousset, J. Henninges, H. Blanck. Eur. Geotherm. Congr., 18, 16670(2016).
[10] I. L. Chen Ning, P. Sava. Geophys. Prospect., 66, 1111(2018).
[11] H. F. Martins, S. Martin-Lopez, P. Corredera, M. L. Filograno, O. Frazao, M. Gonzalez-Herraez. J. Light. Technol., 32, 1510(2014).
[12] Y. Xu, R. Wilcox, J. Byrd, L. Doolittle, Q. Du, G. Huang, Y. Yang, T. Zhou, L. Yan, W. Huang, C. Tang. Chin. Opt. Lett., 16, 040701(2018).
[13] A. Masoudi, T. P. Newson. Opt. Lett., 42, 290(2017).
[14] A. Masoudi, T. P. Newson. Opt. Express, 25, 32021(2017).
[15] E. Alekseev, V. S. Vdovenko, B. G. Gorshkov, V. T. Potapov, I. A. Sergachev, D. E. Simikin. Quantum Electron., 44, 965(2014).
[16] E. Alekseev, V. S. Vdovenko, B. G. Gorshkov, V. T. Potapov, D. E. Simikin. Laser Phys., 25, 65101(2015).
[17] X. He, S. Xie, F. Liu, S. Cao, L. Gu, X. Zheng, M. Zhang. Opt. Lett., 42, 442(2017).
[18] Y. Muanenda, S. Faralli, C. J. Oton, F. Di Pasquale. Opt. Express, 26, 687(2018).
[19] Y. Shan, W. Ji, X. Dong, L. Cao, M. Zabihi, Q. Wang, Y. Zhang, X. Zhang. J. Light. Technol., 37, 2700(2019).
[20] Y. Lu, T. Zhu, L. Chen, X. Bao. J. Light. Technol., 28, 3243(2010).
[21] H. Liu, F. Pang, L. Lv, X. Mei, Y. Song, J. Chen, T. Wang. IEEE Photonics J., 10, 7101309(2018).
[22] S. Gao, R. Hui. Opt. Lett., 37, 2022(2012).
[23] Q. Ye, C. Yang, Y. Chong, X. Li. Chin. Opt. Lett., 11, 071202(2013).
[24] G. Qiang, B. Niu, W. Zhao, Q. Kan, X. Gu, F. Zhou, Y. Kong. Chin. Opt. Lett., 17, 061301(2019).