
Hong Jia, Hongming Jiang, Yuping Zhang, Shuxu Hua, Qing Liu, Yuquan Yuan, Yanfei Hu, Feng Peng, Xiaofeng Liu, "Enhanced near-infrared light-induced photoresponse via transition of monocrystalline phase and surface reconstruction," Chin. Opt. Lett. 21, 051603 (2023)
- Chinese Optics Letters
- Vol. 21, Issue 5, 051603 (2023)
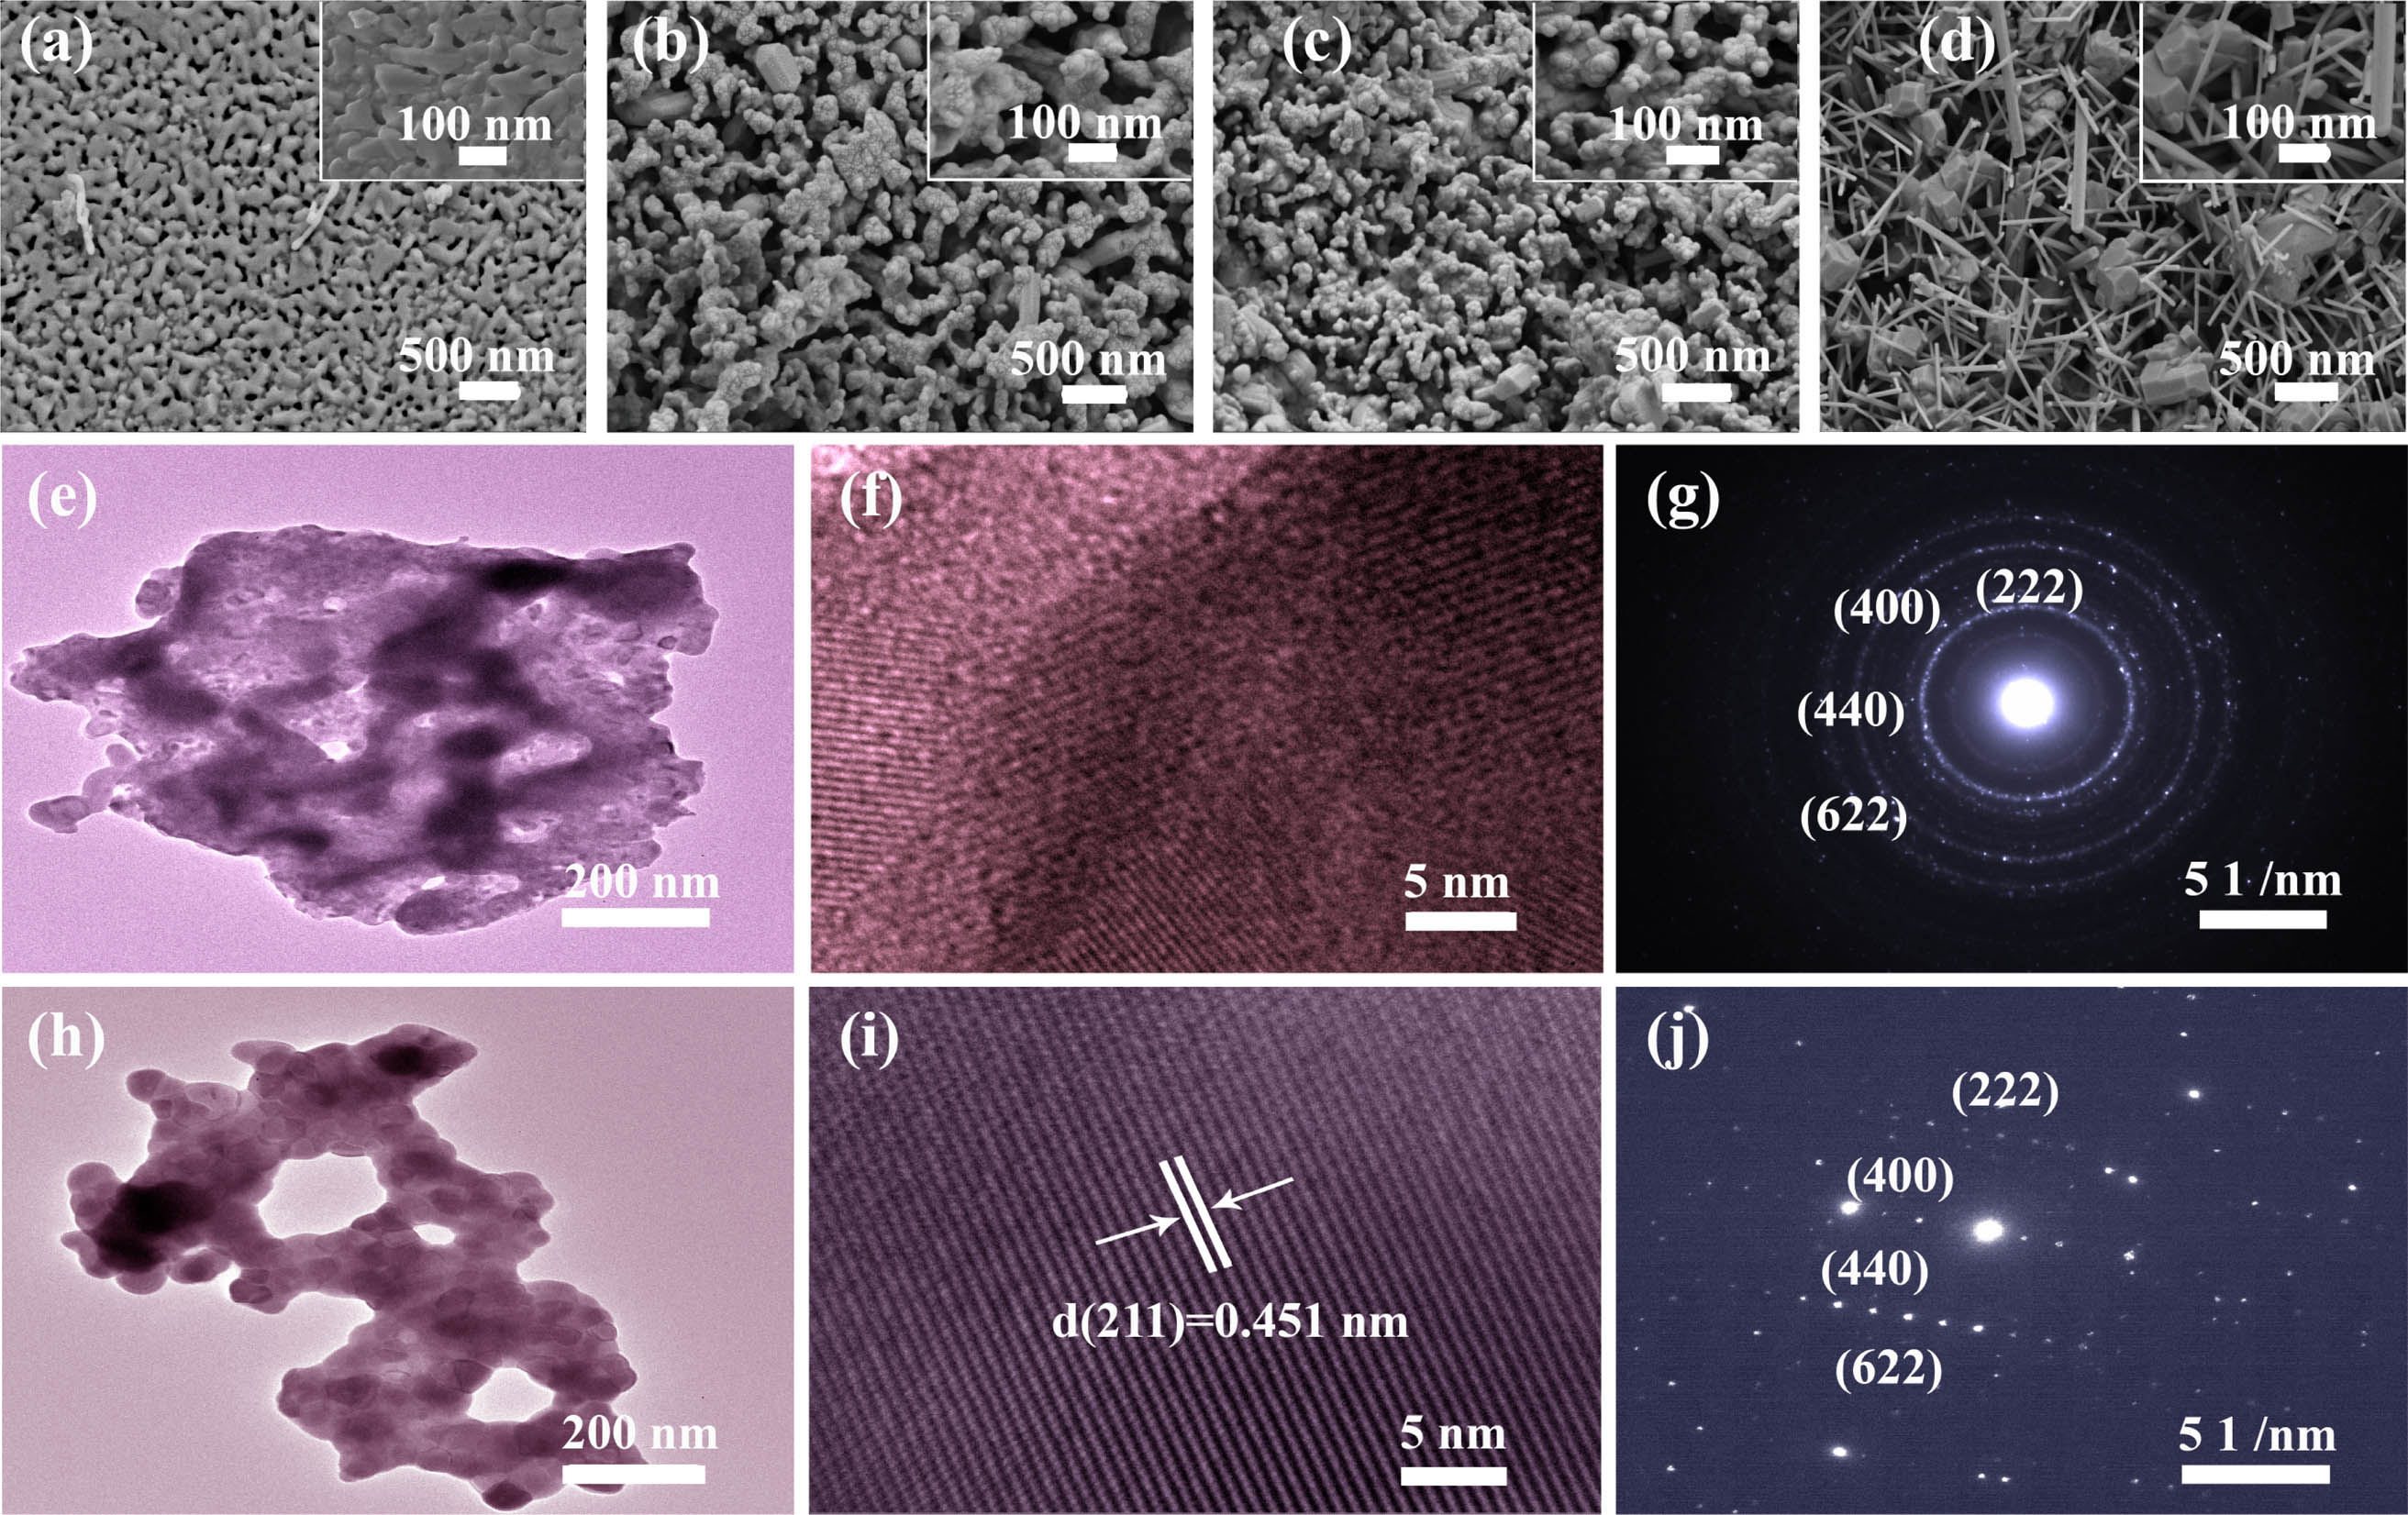
Fig. 1. SEM images of the synthesized samples: (a) Gd2O3: 3% Er3+; (b) Gd2O3: 3% Er3+, 10% Na+; (c) Gd2O3: 3% Er3+, 7% K+; (d) Gd2O3: 3% Er3+, 3% Cs+. (e), (h) TEM images; (f), (i) HRTEM images; (g), (j) SAED patterns of Gd2O3: 3% Er3+ and Gd2O3: 3% Er3+, 10% Na+ phosphors.
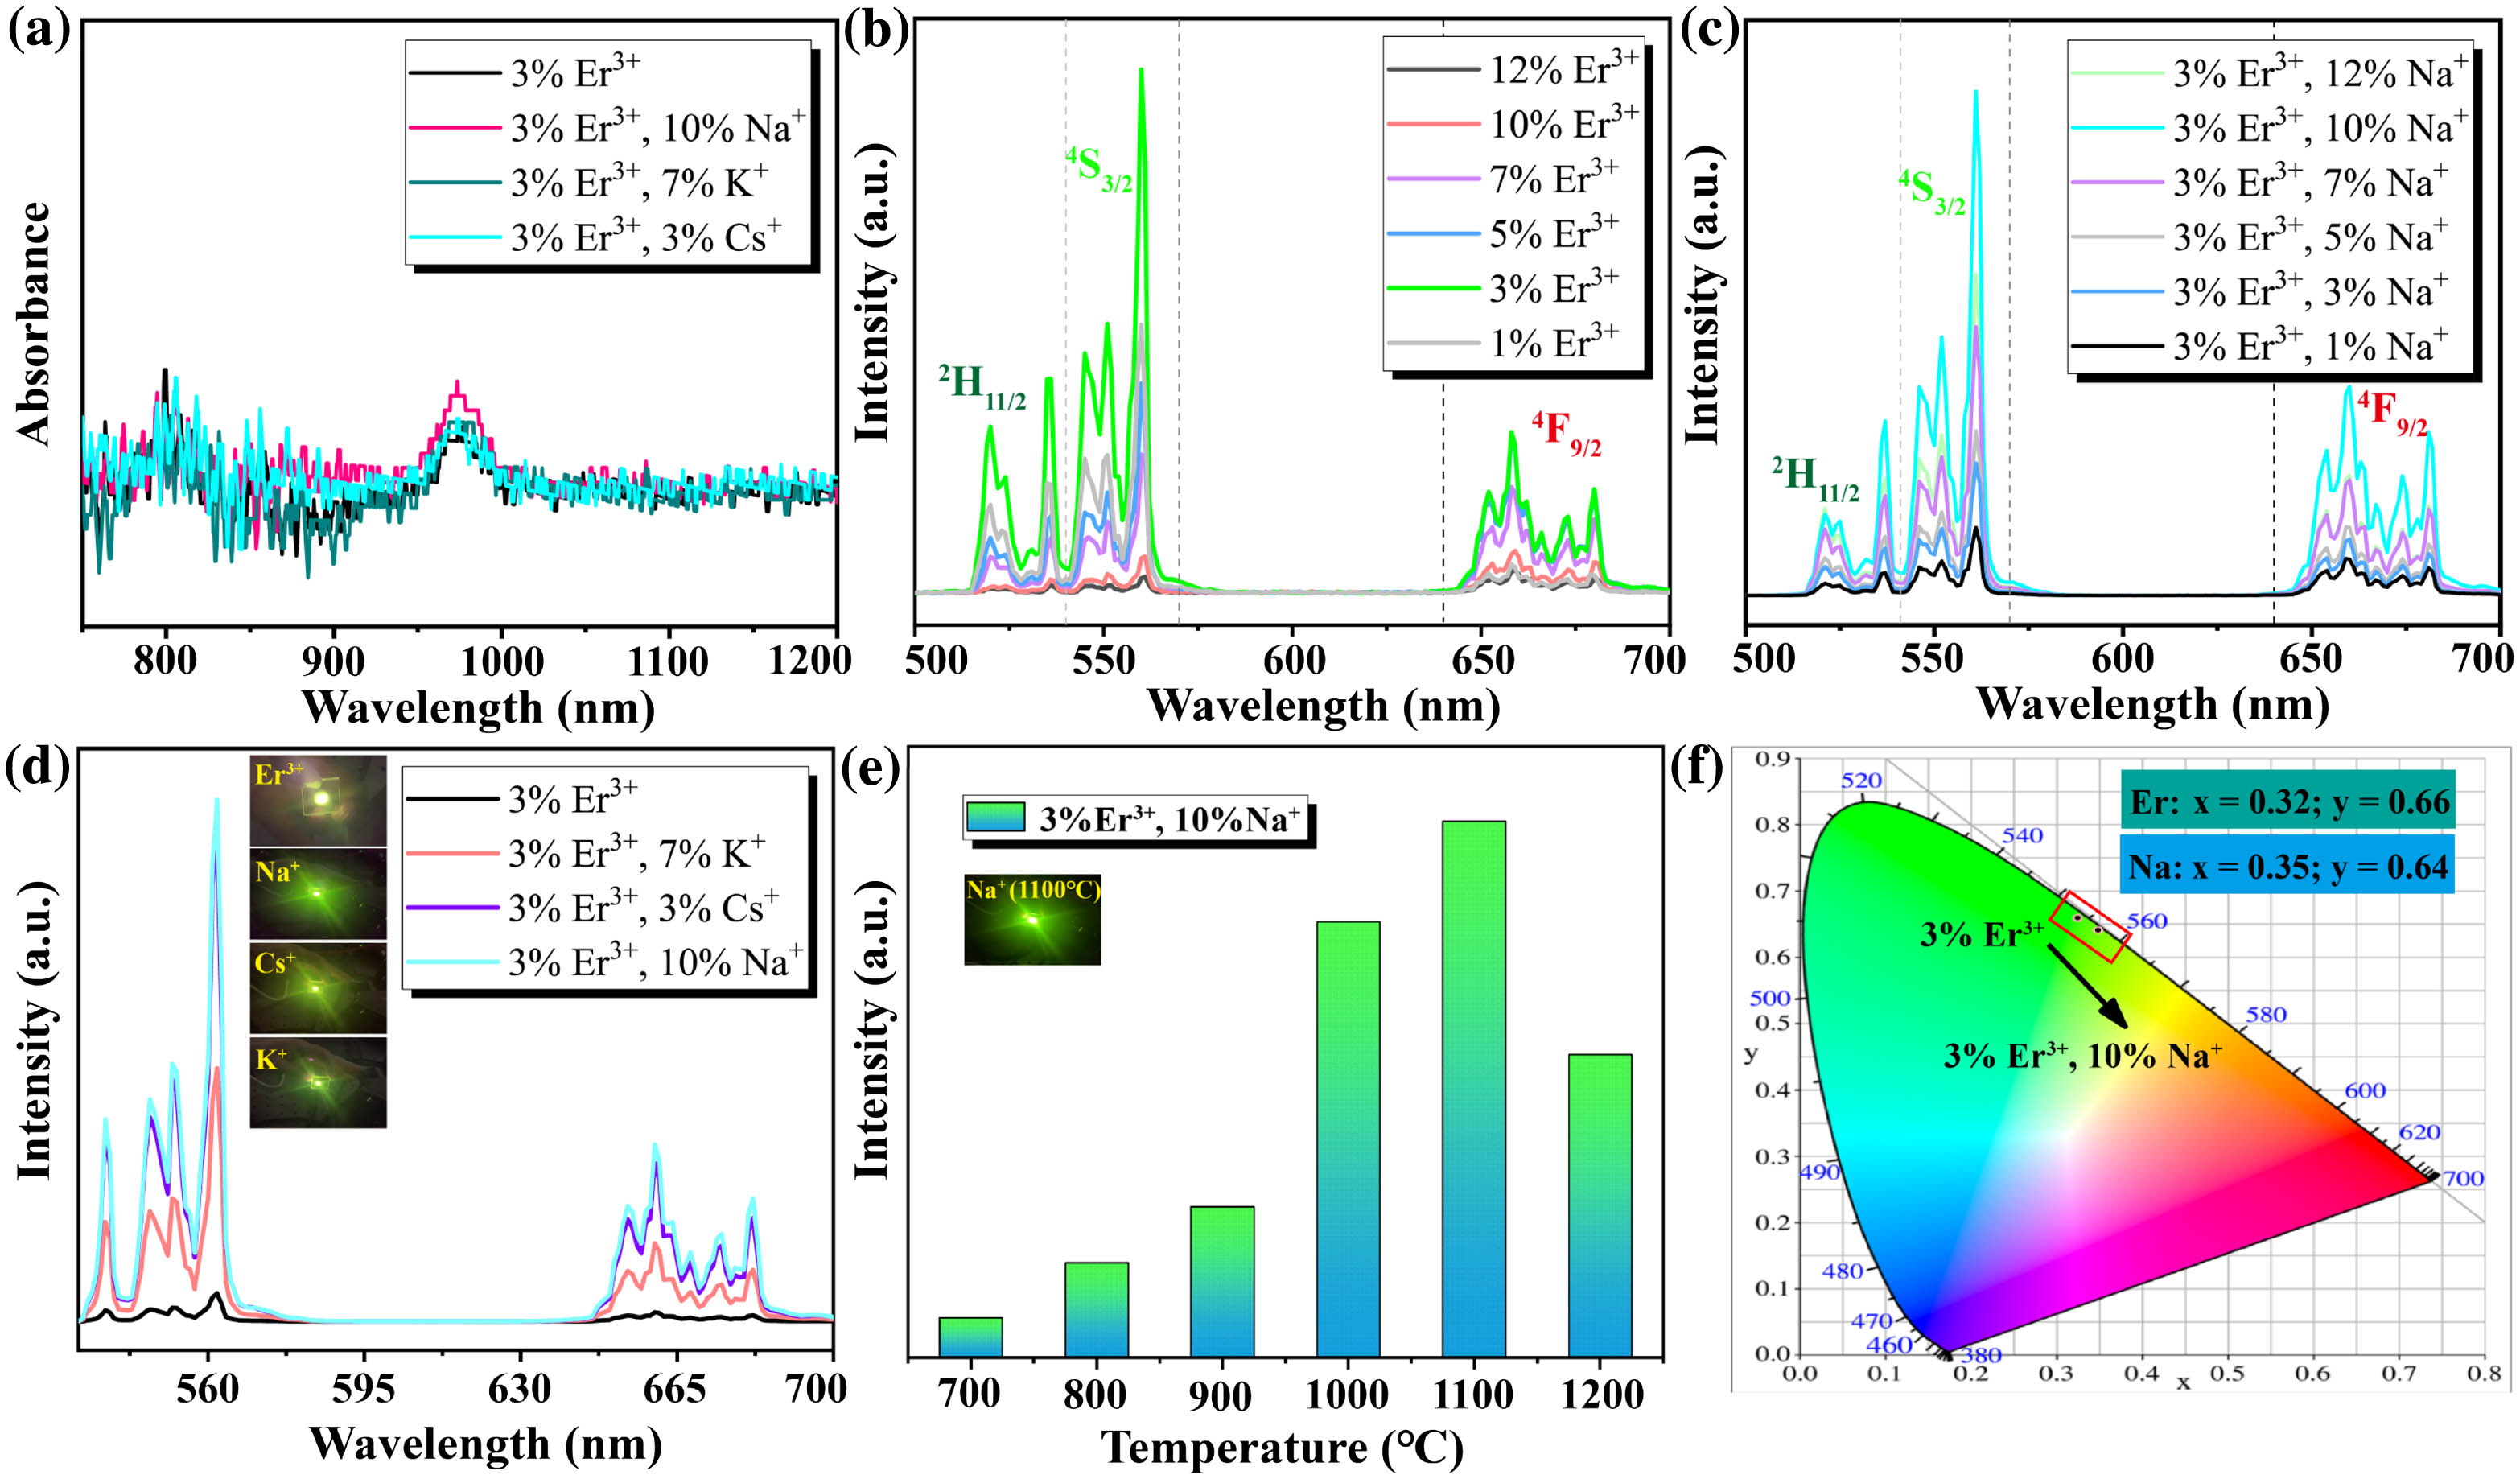
Fig. 2. (a) Absorption spectra of Gd2O3: 3% Er3+ and Gd2O3: 3% Er3+, yM+ (M = Na, K, Cs; y = 10%, 7%, 3%). UC PL emission spectra for (b) Gd2O3: xEr3+ (x = 1%, 3%, 5%, 7%, 10%, 12%); (c) Gd2O3: 3% Er3+, yNa+ (y = 1%, 3%, 5%, 7%, 10%, 12%); and (d) Gd2O3: 3% Er3+, zM+ (M = Na, K, Cs; z = 10%, 7%, 3%). (e) Luminescence intensity of the Gd2O3: 3% Er3+, 10% Na+ phosphors at different annealing temperatures; (f) CIE chromaticity diagram of the Gd2O3: 3% Er3+ and the Gd2O3: 3% Er3+, 10% Na+ phosphors.
Fig. 3. (a), (b) Logarithmic patterns of power dependence of 3% Er3+ and 3% Er3+, 10% Na+-doped Gd2O3 sample materials in red and green wavebands; (c) emission attenuation curves of Gd2O3: 3% Er3+ and Gd2O3: 3% Er3+, 10% Na+ phosphors were fitted by a double exponential decay function (980 nm excitation); (d) possible UC mechanism of Er3+ ions under 980 nm excitation.
Fig. 4. Photocurrent response of the device incorporating Gd2O3: 3% Er3+/PMMA and Gd2O3: 3% Er3+, 10% Na+/PMMA composite films under the square pulse with an NIR wavelength of 980 nm, the applied potential of 0 V, and 2 s off/on cycles.


Set citation alerts for the article
Please enter your email address

© Copyright 2018-2021 | Chinese Laser Press. All Rights Reserved 沪ICP备15018463号-20