
Ningning Zhang, Yi Zhang, Jun Bao, Feng Zhang, Sen Yan, Song Sun, Chen Gao. Luminescent solar concentrators with a bottom-mounted photovoltaic cell: performance optimization and power gain analysis[J]. Chinese Optics Letters, 2017, 15(6): 063501
- Chinese Optics Letters
- Vol. 15, Issue 6, 063501 (2017)
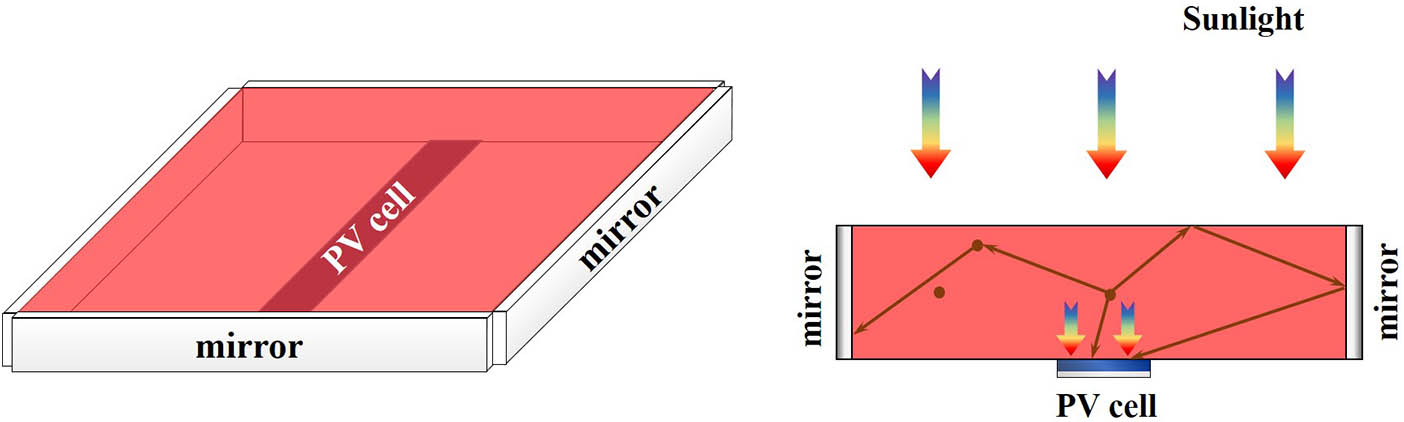
Fig. 1. Schematic of a BM-LSC.
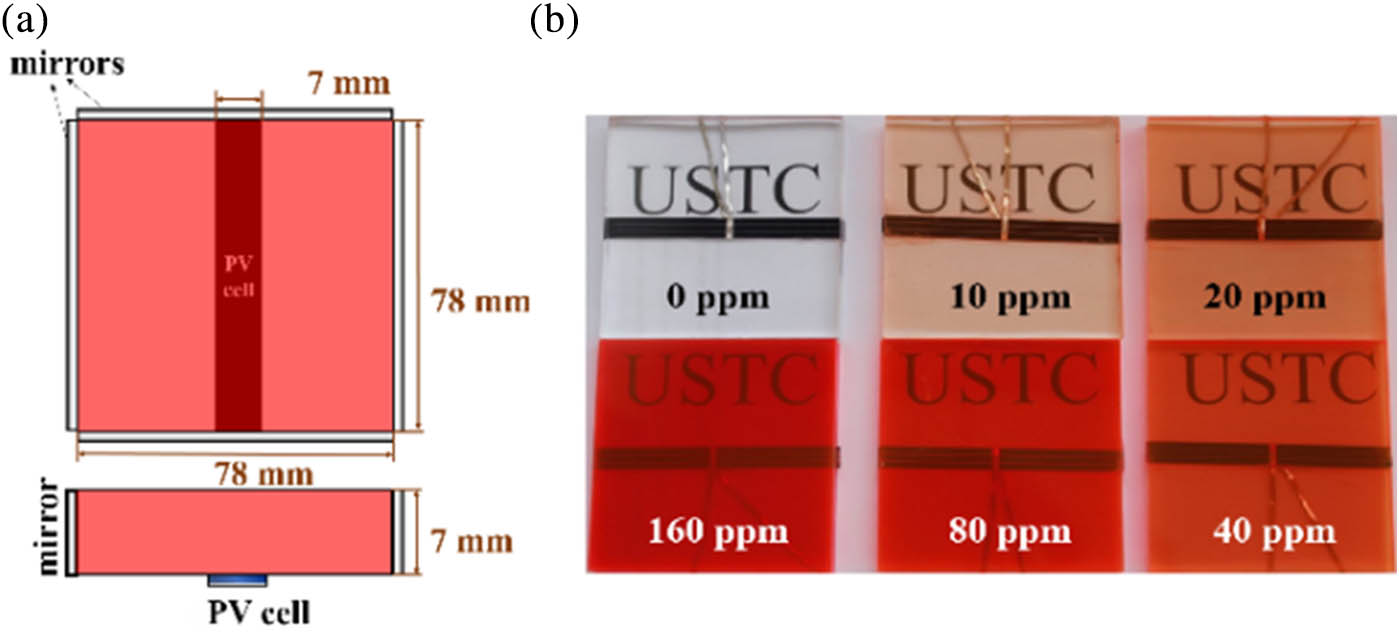
Fig. 2. (a) Schematic diagram of a fabricated BM-LSC. (b) Photograph of the BM-LSCs with varied dye concentrations from 0 to 160 ppm.
Fig. 3. Normalized absorption (dash line) and emission (solid line) of Yellow 083 (black) and Red 305 (red) in ethyl alcohol. Here, the abbreviations of Y Absorp., R Absorp., Y Emiss., and R Emiss. represent Yellow 083 absorption, Red 305 absorption, Yellow 083 emission, and Red 305 emission, respectively.
Fig. 4. Gain of BM-LSCs with the enhancement of white back reflector and mirrors as a function of mixed dye concentrations. The inset illustrates the schematic of the light transmission path within a BM-LSC on the white back reflector.
Fig. 5. Schematic diagram of the device for measuring the side emission spectra of dye-doped PMMA plates using a fiber optic spectrometer.
Fig. 6. (a) Side emission spectra of the PMMA plate with the dye concentration of 40 ppm as a function of the distance between the laser beam (405 nm) and fiber probe; (b) the side emission spectra of the PMMA plates with varying dye concentrations. The distance between a 405 nm laser beam and the fiber probe was 4 cm.
Fig. 7. Power gain derived from the transmitted light with varying dye concentrations. The inset illustrates schematic of measuring the contribution from transmitted light to the BM-LSC power gain.
Fig. 8. Power gain derived from the waveguide light with varying dye concentrations. The inset illustrates the schematic of measuring the contribution from waveguide light to the BM-LSC power gain.
|
Table 1. Power Gain Derived from the Contributions of Transmitted Light, Waveguide Light, and Reflected Light from Back White Reflector

Set citation alerts for the article
Please enter your email address
© Copyright 2018-2021 | Chinese Laser Press. All Rights Reserved 沪ICP备15018463号-20