
Tianwei YU, Enrang ZHENG, Junge SHEN, Kai WANG. Optical Remote Sensing Image Scene Classification Based on Multi-level Cross-layer Bilinear Fusion[J]. Acta Photonica Sinica, 2022, 51(2): 0210007
- Acta Photonica Sinica
- Vol. 51, Issue 2, 0210007 (2022)
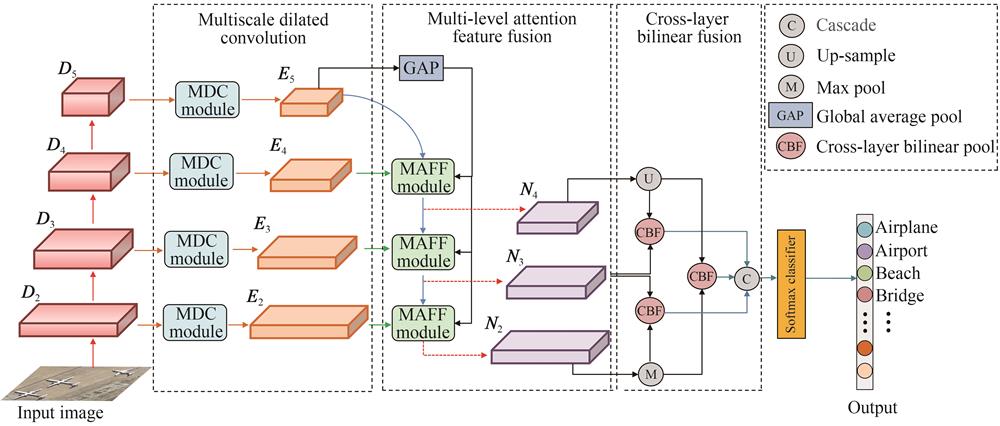
Fig. 1. Overall flowchart of the proposed method
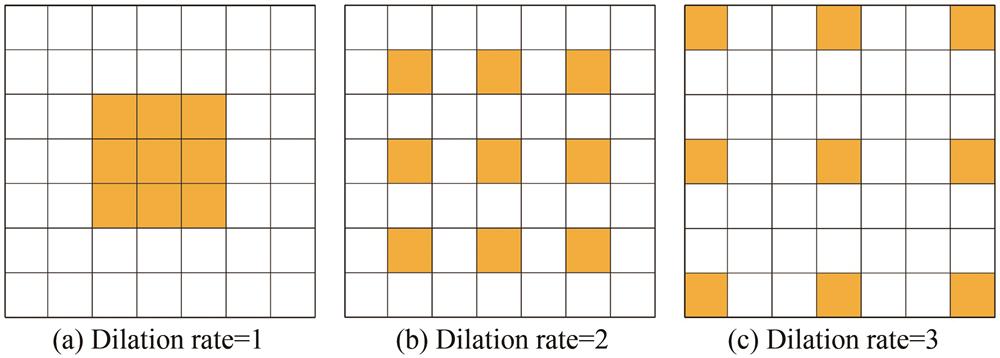
Fig. 2. Dilated convolution with different dilation rate
Fig. 3. Multiscale dilated convolution module
Fig. 4. Multi-level attention feature fusion module
Fig. 5. Spatial attention module
Fig. 6. CM on UCM dataset with a training ratio of 80%
Fig. 7. Typical samples of forest and parking lot categories and misclassification samples
Fig. 8. CM on AID dataset with a training ratio of 50%
Fig. 9. Samples from river、port and bridge scene categories of AID dataset
Fig. 10. CM on PatternNet dataset with a training ratio of 20%
|
Table 1. Scene dataset information
|
Table 2. Influence of parameter d on classification performance of AID dataset
|
Table 3. Ablation experiment on AID dataset with a training ratio of 20%
|
Table 4. Classification result comparison on UCM dataset
|
Table 5. Classification result comparison on AID dataset
|
Table 6. Classification result comparison on PatternNet dataset

Set citation alerts for the article
Please enter your email address
© Copyright 2018-2021 | Chinese Laser Press. All Rights Reserved 沪ICP备15018463号-20