
Simon Messelot, Solen Coeymans, Jérôme Tignon, Sukhdeep Dhillon, Juliette Mangeney, "High Q and sub-wavelength THz electric field confinement in ultrastrongly coupled THz resonators," Photonics Res. 11, 1203 (2023)
- Photonics Research
- Vol. 11, Issue 7, 1203 (2023)
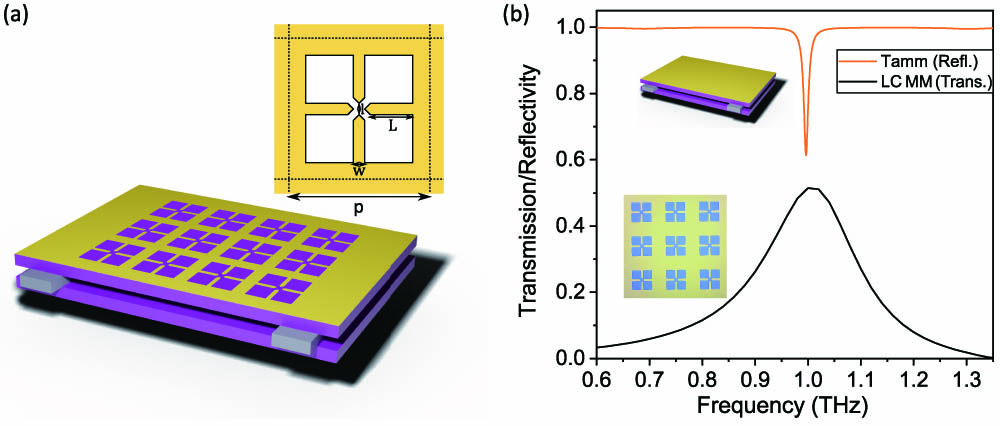
Fig. 1. (a) Representation of the Tamm cavity/LC metamaterial coupled resonators structure and unit cell pattern of the LC metamaterial. (b) Reflection and transmission spectra of the uncoupled Tamm cavity and LC metamaterial, respectively, alongside their representations (inset).

Fig. 2. (a) Transmission spectra of the Tamm cavity-LC metamaterial coupled resonators for decreasing (bottom to top) LC resonance frequencies f LC f LC
Fig. 3. (a) Resonance peak linewidth of the two coupled modes from Lorentzian fit on data from Fig. 2 (a). Dashed lines are guide for the eyes. (b) Schematic picture of the Tamm cavity and LC metamaterial directly on top, including radiative channels s 1 s 2 A B
Fig. 4. Reflection spectra of a Tamm cavity resonant at approximately 0.95 THz coupled with an LC metamaterial resonant at 0.92 THz, including an additional mirror blocking the transmission. Blue, two-layer Tamm cavity with Q = 25.2 ± 1.6 Q = 32.6 ± 1.2 Q = 35 ± 6 Q = 37 ± 5
Fig. 5. (a) Distribution of the electric field in the LC metamaterial plane over a single unit cell from FEM simulations for the upper frequency coupled mode at f LC = 1.01 THz r 0 10 ) and (11 ). The mode volume values at zero detuning are 3.2 × 10 − 4 λ 3 V + 2.0 × 10 − 4 λ 3 V −
Fig. 6. Schematic coupling scheme between resonators A B s 1 s 2
Fig. 7. Theoretical reflection and transmission spectra of the coupled resonator system from Eqs. (A23 ) and (A24 ). We used f A = f B = 1 THz G = 0.1 THz Γ A = 0.01 THz Γ B = 0.05 THz Γ rad 1 , A = 0.008 THz Γ rad 2 , B = 0.045 THz
Fig. 8. Schematic pictures of the resonators under study, including input illumination “1” for (a) the LC circuit metamaterial on an infinite silicon substrate and (b) the Tamm cavity coupled to the LC circuit metamaterial directly on top. Bottom, corresponding interaction scheme between the Tamm mode A B
Fig. 9. Evolution of the radiative coupling rate to the substrate Γ rad 1 , LC G
Fig. 10. Comparison of the radiative coupling rate to the substrate of a CSRR metamaterial Γ rad 1 , LC G 2 C Tamm n Sub
Fig. 11. (a) Resonance peak of an uncoupled LC metamaterial on an infinite silicon substrate with transmission blocked for increasing f LC Γ rad 1 , LC f LC
Fig. 12. Electric field enhancement along the optical axis for the higher (red) and lower (blue) resonant coupled modes, without (left) and with (right) the additional mirror. The cut axes intersect the metamaterial plane at the center of the metamaterial unit cell. The cavity is illuminated from the left with a plane wave of unity amplitude, the LC metamaterial is located at z = 0 z = + 75 μm
Fig. 13. (a) Mode volume of the uncoupled metamaterial (black) and of the upper (red) and lower (blue) frequency coupled modes, computed from COMSOL simulation. (b) Same, normalized by the value of λ 3
|
Table 1. Comparison of V Q a


Set citation alerts for the article
Please enter your email address

© Copyright 2018-2021 | Chinese Laser Press. All Rights Reserved 沪ICP备15018463号-20