
Yong Li, Debing Tan, Qiang Wang, Zhengguo Xiao, Changhai Tian, Lin Chen. Crystallization and characteristics of {100}-oriented diamond with CH4N2S additive under high pressure and high temperature[J]. Chinese Physics B, 2020, 29(9):
- Chinese Physics B
- Vol. 29, Issue 9, (2020)
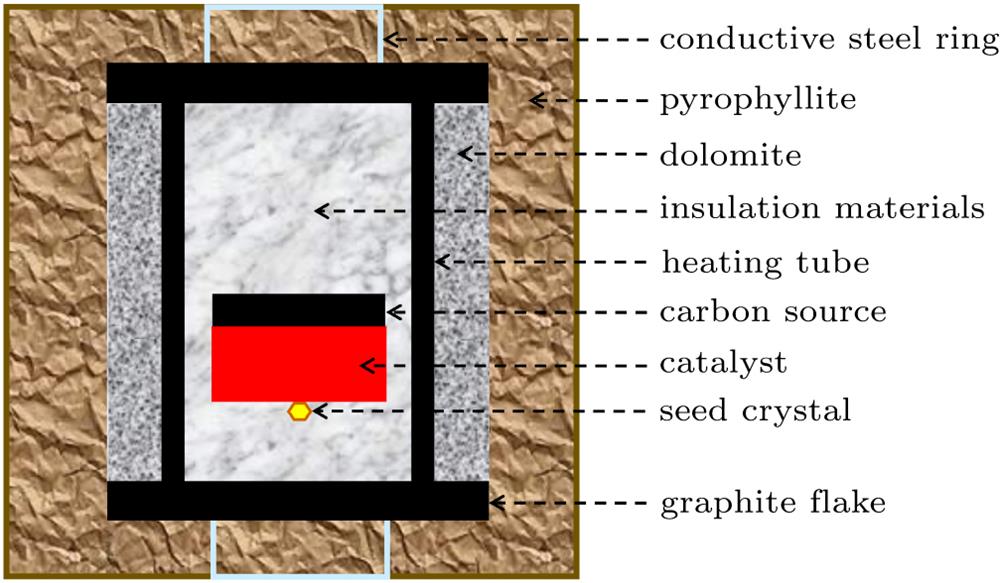
Fig. 1. Schematic diagram of the cell for diamond synthesis.
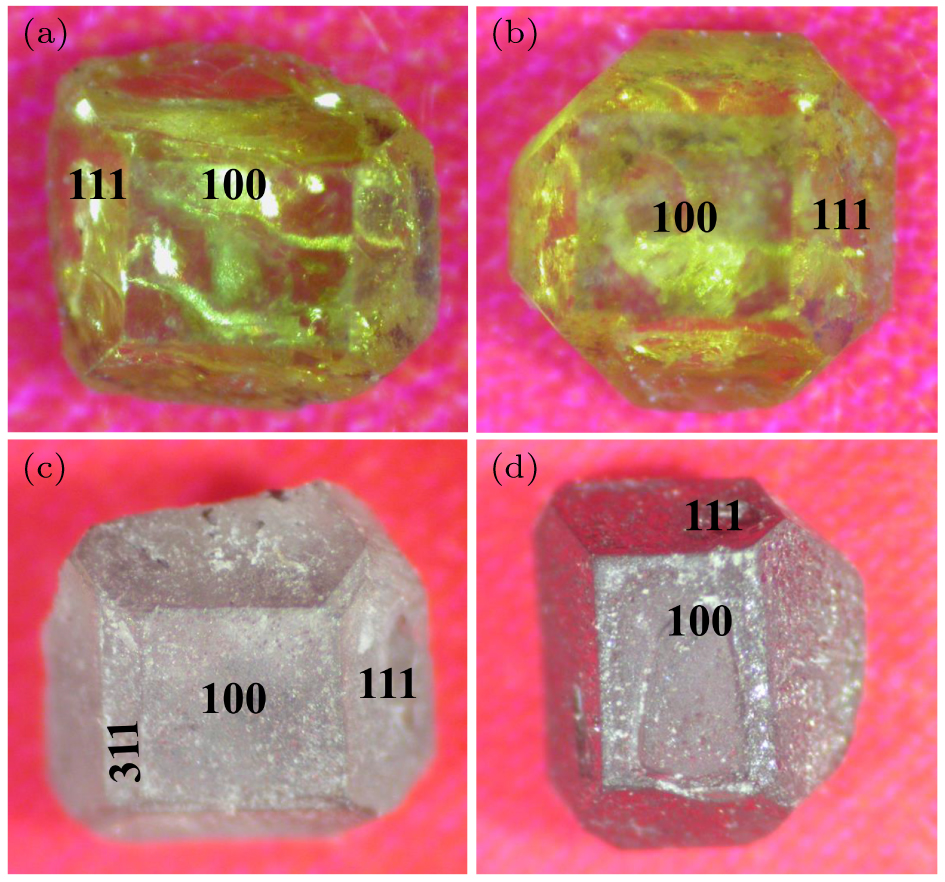
Fig. 2. Optical morphology of the synthesized diamond crystals with different concentrations of CH4N2S additive or CH4N2S + Ti/Cu additives. (a) 0.2 mg CH4N2S additive, (b) 0.3 mg CH4N2S additive, (c) 0.2 mg CH4N2S + Ti/Cu additives, (d) 0.3 mg CH4N2S + Ti/Cu additives.
Fig. 3. Raman shift and FWHM of the synthesized diamond with different concentrations of CH4N2S additive or CH4N2S + Ti/Cu additives. (a) 0.2 mg CH4N2S additive, (b) 0.3 mg CH4N2S additive, (c) 0.2 mg CH4N2S + Ti/Cu additives, (d) 0.3 mg CH4N2S + Ti/Cu additives.
Fig. 4. (a), (b) FTIR spectra of the synthesized diamond crystals with different concentrations of CH4N2S additive or CH4N2S + Ti/Cu additives. The green, blue, red, and black curves represent the FTIR spectra of the synthesized diamond crystals with 0.2 mg CH4N2S additive, 0.3 mg CH4N2S additive, 0.2 mg CH4N2S + Ti/Cu additives, and 0.3 mg CH4N2S + Ti/Cu additives, respectively.
Fig. 5. PL spectra of the synthesized diamond crystals taken at room temperature, excited by the 488 nm line: (a) with 0.2 mg CH4N2S additive, (b) with 0.3 mg CH4N2S additive, (c) with 0.2 mg CH4N2S + Ti/Cu additives, (d) with 0.3 mg CH4N2S + Ti/Cu additives.
|
Table 1. Experimental parameters of diamond synthesized in the FeNiCo-C system.

Set citation alerts for the article
Please enter your email address
© Copyright 2018-2021 | Chinese Laser Press. All Rights Reserved 沪ICP备15018463号-20