Author Affiliations
1School of Materials Science and Engineering, Harbin Institute of Technology, Shenzhen 518055, Guangdong , China2Zhengzhou Research Institute, Harbin Institute of Technology, Zhengzhou 450046, Henan , China3Key Laboratory of Micro-systems and Micro-structures Manufacturing of Ministry of Education, Harbin Institute of Technology, Harbin 150080, Heilongjiang , Chinashow less
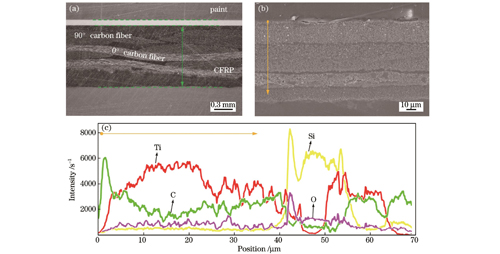
Fig. 1. Morphologies of CFRP sample and composition of paint layer elements. (a) Macroscopic morphology of CFRP sample; (b) microscopic morphology of CFRP sample; (c) composition of paint layer elements
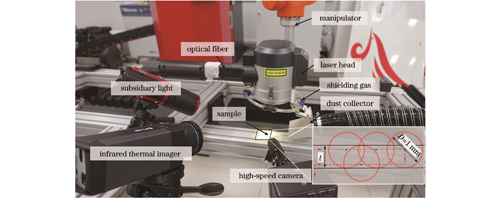
Fig. 2. Laser cleaning system
Fig. 3. Measurement items of laser confocal microscope. (a) Laser cleaning depth; (b) surface roughness of laser cleaning area
Fig. 4. Macroscopic morphologies of CFRP sample after laser cleaning
Fig. 5. SEM images of CFRP samples after laser cleaning. (a1)(a2) Sample No. 22; (b1)(b2) sample No. 20; (c1)(c2) sample No. 25
Fig. 6. 3D profiles of laser cleaning areas of CFRP samples
Fig. 7. 3D profiles of cleaned-uncleaned boundary areas
Fig. 8. Infrared thermal imaging patterns of samples at peak temperature
Fig. 9. Infrared thermal imaging images. (a) Typical infrared thermal imaging feature of cleaning area; (b) temperature response curve during laser cleaning; (c)‒(h) infrared thermal imaging characteristics of samples at different moments during cleaning process (interval of 1/25 s)
Fig. 10. Dynamic behavior during laser cleaning
| Parameter | Level 1 | Level 2 | Level 3 | Level 4 | Level 5 |
|---|
| Laser power /W | 100 | 150 | 200 | 250 | 300 | | Scanning speed /(mm/s) | 3000 | 2500 | 2000 | 1500 | 1000 | | Repetition frequency /kHz | 20 | 25 | 30 | 35 | 40 | | Overlap ratio /% | 90 | 80 | 70 | 60 | 50 |
|
Table 1. Experimental variables and levels
| Order No. | P /W | V /(mm/s) | f /kHz | η /% | Order No. | P /W | V /(mm/s) | f /kHz | η /% |
|---|
| 1 | 100 | 3000 | 20 | 90 | 14 | 200 | 1500 | 20 | 70 | | 2 | 100 | 2500 | 25 | 80 | 15 | 200 | 1000 | 25 | 60 | | 3 | 100 | 2000 | 30 | 70 | 16 | 250 | 3000 | 35 | 80 | | 4 | 100 | 1500 | 35 | 60 | 17 | 250 | 2500 | 40 | 70 | | 5 | 100 | 1000 | 40 | 50 | 18 | 250 | 2000 | 20 | 60 | | 6 | 150 | 3000 | 25 | 70 | 19 | 250 | 1500 | 25 | 50 | | 7 | 150 | 2500 | 30 | 60 | 20 | 250 | 1000 | 30 | 90 | | 8 | 150 | 2000 | 35 | 50 | 21 | 300 | 3000 | 40 | 60 | | 9 | 150 | 1500 | 40 | 90 | 22 | 300 | 2500 | 20 | 50 | | 10 | 150 | 1000 | 20 | 80 | 23 | 300 | 2000 | 25 | 90 | | 11 | 200 | 3000 | 30 | 50 | 24 | 300 | 1500 | 30 | 80 | | 12 | 200 | 2500 | 35 | 90 | 25 | 300 | 1000 | 35 | 70 | | 13 | 200 | 2000 | 40 | 80 | | | | | |
|
Table 2. Orthogonal array (L25)
| Sample No. | H | Sa | T |
|---|
| Measured value | S/N | Measured value | S/N | Measured value | S/N |
|---|
| 1 | 6.40 μm | 16.12 | 4.28 μm | 12.63 | 396.2 ℃ | -51.96 | | 2 | 7.20 μm | 17.15 | 2.33 μm | 7.35 | 349.3 ℃ | -50.86 | | 3 | 8.80 μm | 18.89 | 1.09 μm | 0.75 | 301.2 ℃ | -49.58 | | 4 | 3.30 μm | 10.37 | 1.23 μm | 1.80 | 302.0 ℃ | -49.60 | | 5 | 1.90 μm | 5.58 | 3.40 μm | 10.63 | 344.1 ℃ | -50.73 | | 6 | 3.00 μm | 9.54 | 1.48 μm | 3.41 | 311.9 ℃ | -49.88 | | 7 | 2.90 μm | 9.25 | 0.88 μm | -1.11 | 271.3 ℃ | -48.67 | | 8 | 2.00 μm | 6.02 | 1.01 μm | 0.09 | 272.2 ℃ | -48.70 | | 9 | 35.86 μm | 31.09 | 4.35 μm | 12.77 | 552.5 ℃ | -54.85 | | 10 | 37.97 μm | 31.59 | 4.89 μm | 13.79 | 485.7 ℃ | -53.73 | | 11 | 2.40 μm | 7.60 | 1.20 μm | 1.58 | 295.0 ℃ | -49.40 | | 12 | 58.70 μm | 35.37 | 6.27 μm | 15.95 | 590.4 ℃ | -55.42 | | 13 | 42.90 μm | 32.65 | 2.52 μm | 8.03 | 433.7 ℃ | -52.74 | | 14 | 16.20 μm | 24.19 | 1.55 μm | 3.81 | 377.3 ℃ | -51.53 | | 15 | 20.70 μm | 26.32 | 2.43 μm | 7.71 | 404.3 ℃ | -52.13 | | 16 | 12.20 μm | 21.73 | 2.29 μm | 7.20 | 410.0 ℃ | -52.26 | | 17 | 15.70 μm | 23.92 | 2.12 μm | 6.53 | 370.2 ℃ | -51.37 | | 18 | 9.82 μm | 19.84 | 1.19 μm | 1.51 | 293.9 ℃ | -49.36 | | 19 | 11.70 μm | 21.36 | 1.93 μm | 5.71 | 327.3 ℃ | -50.30 | | 20 | 140.50 μm | 42.95 | 9.74 μm | 19.77 | 599.6 ℃ | -55.56 | | 21 | 6.90 μm | 16.78 | 2.11 μm | 6.49 | 298.1 ℃ | -49.49 | | 22 | 9.90 μm | 19.91 | 1.54 μm | 3.75 | 264.5 ℃ | -48.45 | | 23 | 70.09 μm | 37.01 | 9.02 μm | 19.10 | 506.5 ℃ | -54.09 | | 24 | 44.50 μm | 32.97 | 3.16 μm | 9.99 | 508.6 ℃ | -54.13 | | 25 | 43.40 μm | 32.75 | 7.24 μm | 17.19 | 467.1 ℃ | -53.39 |
|
Table 3. Values and S/N statistics of H, Sa, and T
| Level | Average S/N response for H | | Average S/N response for Sa | | Average S/N response for T |
|---|
| P | V | f | η | | P | V | f | η | | P | V | f | η |
|---|
| K1 | 13.62 | 14.35 | 22.33 | 32.51 | | 6.63 | 6.26 | 7.10 | 16.04 | | 50.55 | 50.60 | 51.01 | 54.38 | | K2 | 17.50 | 21.12 | 22.28 | 27.22 | | 5.79 | 6.49 | 8.66 | 9.27 | | 51.16 | 50.95 | 51.45 | 52.74 | | K3 | 25.23 | 22.88 | 22.33 | 21.86 | | 7.42 | 5.90 | 6.20 | 6.34 | | 52.25 | 50.89 | 51.47 | 51.15 | | K4 | 25.96 | 24.00 | 21.25 | 16.51 | | 8.14 | 6.82 | 8.44 | 3.28 | | 51.77 | 52.08 | 51.87 | 49.85 | | K5 | 27.88 | 27.84 | 22.00 | 12.10 | | 11.31 | 13.82 | 8.89 | 4.35 | | 51.91 | 53.11 | 51.84 | 49.52 | | σ | 14.26 | 13.48 | 1.08 | 20.42 | | 5.52 | 7.923 | 2.70 | 12.77 | | 1.70 | 2.51 | 0.87 | 4.86 | | Rank | 2 | 3 | 4 | 1 | | 3 | 2 | 4 | 1 | | 3 | 2 | 4 | 1 |
|
Table 4. Average S/N response
| Source | DF | Adj-SS | Adj-MS | F value | | Rate of contribution /% |
|---|
| P | 4 | 755.94 | 188.99 | 14.53 | 0.001 | 28.72 | | V | 4 | 490.28 | 122.57 | 9.43 | 0.004 | 18.62 | | f | 4 | 4.28 | 1.07 | 0.08 | 0.986 | 0.16 | | η | 4 | 1329.64 | 332.41 | 25.56 | 0 | 50.51 | | Error | 8 | 104.03 | 13 | | | 1.98 | | Total | 24 | 2684.17 | | | | |
|
Table 5. Results of variance analysis in H
| Source | DF | Adj-SS | Adj-MS | F value | | Rate of contribution /% |
|---|
| P | 4 | 89.79 | 22.45 | 8.5 | 0.006 | 10.15 | | V | 4 | 224.44 | 56.11 | 21.24 | 0 | 25.36 | | f | 4 | 26.89 | 6.72 | 2.54 | 0.122 | 3.04 | | η | 4 | 522.87 | 130.72 | 49.47 | 0 | 59.07 | | Error | 8 | 21.14 | 2.64 | | | 2.39 | | Total | 24 | 885.13 | | | | |
|
Table 6. Results of variance analysis in Sa
| Source | DF | Adj-SS | Adj-MS | F value | | Rate of contribution /% |
|---|
| P | 4 | 9.07 | 2.27 | 9.13 | 0.004 | 7.66 | | V | 4 | 22.01 | 5.5 | 22.15 | 0 | 18.56 | | f | 4 | 2.48 | 0.62 | 2.49 | 0.126 | 2.09 | | η | 4 | 82.97 | 20.74 | 83.48 | 0 | 69.09 | | Error | 8 | 1.99 | 0.25 | | | 1.69 | | Total | 24 | 118.51 | | | | |
|
Table 7. Results of variance analysis in T