Guoqiang Lan, Shugang Liu, Xueru Zhang, Yuxiao Wang, Yinglin Song. Highly sensitive and wide-dynamic-range liquid-prism surface plasmon resonance refractive index sensor based on the phase and angular interrogations[J]. Chinese Optics Letters, 2016, 14(2): 022401
Copy Citation Text
In this study, a new method utilizing surface plasmon resonance (SPR) sensing technology based on the phase and angular interrogations for measuring the refractive index of a liquid prism is presented. An orthogonal sample box that combined the functions of a prism, cell box, and mirror is adopted to simplify the system and provide the convenience to implement the phase and angular interrogations. The angular interrogation is achieved by the motorized rotation stage with the new sample box, and the phase interrogation is achieved by the linear polarization interferometry between the s- and p-polarization components. The amplitude reflectivity and the phase angle, which are the functions of the incident angle, are obtained by the reflection intensity and the interference intensity of the lights directly. A sensitivity of refractive index unit (RIU)/0.1° and a dynamic range of 0.5 RIU are obtained experimentally and theoretically.
The Kretschmann–Raether configuration is widely used in surface plasmon resonance (SPR) sensing areas[1]. The typical model of a Kretschmann–Raether SPR configuration is a prism-metal film sample. The SPR is very sensitive to the refractive index of the dielectric around the metal film, and the variations of the refractive index can be indicated by several SPR interrogations[2]. The solid prism is widely used in the Kretschmann–Raether configuration[3]. Interestingly, the liquid can also be used as the “prism” (also called liquid prism or hollow prism[4]); then, the refractive index of the liquid prism can be detected by the SPR technology, namely, the liquid prism is the sample for simultaneous detections[5].
The SPR sensing methods based on amplitude interrogations, which include angular interrogation[6], spectral interrogation[7,8], and intensity interrogation[9], are the most popular SPR sensing configurations in the current literature. In order to obtain a higher sensitivity, the phase interrogation SPR sensor was introduced in recent years[10–14], and the sensitivity of the phase interrogation was improved by 1–3 orders compared with those amplitude interrogations[15]. Different from the amplitude interrogations, the phase interrogation cannot obtain the phase information with respect to the light intensity directly, and the phase acquirements must depend on phase-extraction techniques such as interferometry[13,16–18], polarimetry[19,20], and optical heterodyning[21,22]; thus, the configuration of the phase interrogation is more complicated than that of the amplitude interrogation[23]. A number of pioneering works focused on increasing the sensitivity[24,25], simplifying the structure[26,27], improving the signal-to-noise ratio (SNR)[28] and expanding the dynamic range[29]. However, the main difficulty of current phase interrogation is that the system cannot obtain high sensitivity, a wide dynamic range, and a compact structure simultaneously.
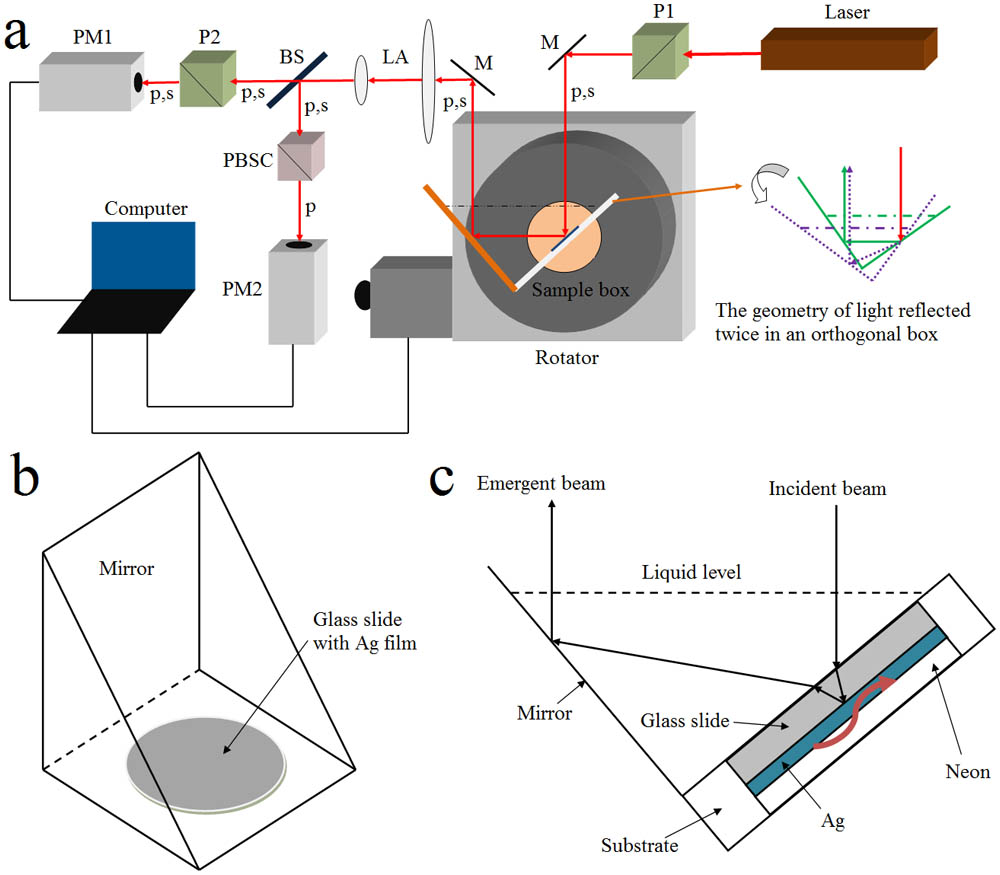
We design a new SPR sensing configuration based on the phase and angular interrogations to achieve a high sensitivity and a wide dynamic range simultaneously, as shown in Fig. 1. The liquid sample box is fastened to the motorized rotation stage, which is placed vertically. A BK7 glass slide (Agar scientific) covered with Ag film (50 nm) is adopted as the sensing chip in the liquid sample box. An He–Ne laser beam with a wavelength of passes through a Glan prism () rotated 45° from the -axis to obtain a 50% -polarization component and a 50% -polarization component. The laser beam is perpendicular to the liquid level after the mirror, and the light spot on the glass slide is just on the center of the rotation stage, so it is stationary when the rotation stage turns a certain angle. The emergent beam reflected twice in the orthogonal V-shaped box is always parallel to the incident light, as shown in Fig. 1(a). Considering that the emergent light shifted parallelly when the rotation stage turned, a telescopic system is adopted to shrink the light beam. The light beam is separated into two beams after a beam splitter. One arm obtained the intensity of the -polarization component after a polarizing beam splitter cube to serve as the angular interrogation; meanwhile, the other arm obtained the interference intensities of the -and -polarization components after another Glan prism (rotated 135° from the -axis, vertical to the first Glan prism) to serve as the phase interrogation. Two power meters and the rotation stage are controlled with a computer synchronously. The three-dimensional structure and the details of the sample box are shown in Figs. 1(b) and 1(c).
Sign up for Chinese Optics Letters TOC. Get the latest issue of Chinese Optics Letters delivered right to you!Sign up now
Figure 1.(a) Experimental setup of the new SPR refractive index sensing system based on the phase and angular interrogations. P1 and P2 are the Glan prisms, M is the mirror, LA is the lens array of the telescopic system, BS is the beam splitter, PBSC is the polarizing beam splitter cube, PM1 and PM2 are the power meters, the geometry of light reflected twice in the orthogonal box is shown in the right side. (b) The three-dimensional structure of the sample box. (c) The details of the sample box.
The theoretical model of our system is a four-layer structure consisted of liquid (sensing sample)-glass-metal-neon, as shown in Fig. 1(c). According to the Fresnel formulae, the reflection coefficient is given by: where is the reflection coefficient of or light, is the phase of or light, is the reflection coefficient of or light between two adjacent layers, is the parallel vector of the wave vector in the -th layer and is the permittivity of the -th layer, is the incident angle, is the wave vector of the incident light in the vacuum, is the thickness of the -th layer, and is the wavelength of the incident light in the vacuum.
The reflectivity and phase angle of the -polarized light, which are the functions of the incident angle with water and ethanol based on Eq. (1), are shown in Fig. 2. The reflectivity and phase angle of the -polarized light are almost invariable according to Eq. (1), so we can use the -polarized light as the reference light to extract the phase of the p-polarized light from the interference intensities of the -and -polarized lights.
Figure 2.Theoretical calculations of the reflectivity and phase angle of the -polarized light. The samples are water and ethanol in the new system. The wavelength of the He–Ne laser is 632.8 nm, and the refractive indices of glass, water, ethanol, Ag, and air are 1.516, 1.333, 1.362, [30], and 1, respectively. The thickness of the Ag film is 50 nm, and the thickness of the glass slide is 170 μm.
The angular interrogation is achieved by the motorized rotation stage with the new sample box. The variation of the refractive index of the liquid prism can change the condition of the SPR when the gas sample adhered to the metal film is stationary; therefore, the liquid prism is the sample for simultaneous measurements. We can obtain the refractive indices of different samples by measuring the different SPR angles. The rigorous condition of the SPR makes the new configuration have the same sensitivity as the conventional prism-based one; this was all tested theoretically and experimentally in our previous works[5]. The SPR angles from 37.4° (the sample with ) to 59° (the sample with ) are the most suitable angles in our system; therefore, the dynamic range of the new configuration is 0.5 refractive index unit (RIU) in principle.
Here, we use linear polarization interferometry to extract the phase difference between the - and -polarization components of different incident angles. The - and -polarization components pass through the same optical components to reduce the environmental fluctuations. Figure 2 shows that the amplitude and phase angle of the -polarization component are both the functions of the incident angle, namely, when the incident angle of the -polarization component changed around the SPR angle, the amplitude is reduced abruptly, and the variation of the phase is sharp. The amplitude of the -polarization component can be detected and analyzed easily, but the phase cannot be observed directly, so we should transform the information of the phase into the intensity of the light. In Fig. 3(a), linear polarization light with angle from the -axis is obtained through polarizer 1, and polarizer 2 is placed vertical to the polarizer 1 to serve as the linear polarization interferometer. and are the amplitudes of the - and -polarization components after polarizer 2, and the interference intensity is obtained from , , and , where is the phase difference between the - and -polarization components after the SPR block. Here, we assume the amplitude of polarization in Fig. 3(a) is stationary. When the phase and amplitude of polarization and are modulated with the SPR simultaneously, the variation of the interference intensity between and can indicate the changes of and directly. In Fig. 3(b), the output amplitude of the - and -polarization components and are given by: where and are given by Eq. (1).
Figure 3.(a) The phase relations between the - and -polarization components in the SPR system. Polarizers 1 and 2 are placed vertically. (b) The geometry of the linear polarization interference.
Because polarizer 2 yields the additional phase difference between the - and -polarization components, and the total phase difference between the - and -polarization components is given by and the final interference intensity of the output - and -polarization components is given by is 45° in our configuration. So Eq. (10) is simplified as where is the intensity of the incident light and is the reflectivity of the s-polarization component. They are the constants in our system, so we can obtain by measuring and at different incident angles. The interference intensity and the reflectivity of the p-polarization component , which are functions of the incident angle, are given in Fig. 4(a), and the corresponding phase difference obtained from Eq. (11) is given in Fig. 4(b). The calculations of in Eq. (11) neglected the negative sign and the jump of the phase angle, and we can obtain the final continuous phase of the p-polarization component by considering these factors, as shown in the inset of Fig. 4(b).
Figure 4.(a) The interference intensity and the reflectivity of the -polarization component at different incident angles. The wavelength of He–Ne is 632.8 nm, and the refractive indices of water, Ag, and air are 1.333, , and 1, respectively. The thickness of the Ag film is 50 nm. (b) The corresponding phase difference at different incident angles, where (a) and (b) are the sign change and (b) and (c) are the jump of the phase angle. The final corresponding phase of the -polarization component considering the above factors is shown in the inset.
To further test the new system, deionized water and ethanol solutions with concentrations from 0.2% to 1% are employed to test the sensitivity. The refractive indices of deionized water and ethanol solutions with concentrations of 1% are measured by an Abbe refractometer at room temperature to get the real values. A value of for the deionized water and a value of for the 1% ethanol solution are obtained, and these values can be used to calibrated the system. The refractive index of the ethanol solution is obtained from the experimental formula in the low concentrations, where is the concentration of the ethanol. It is calculated that the corresponding refractive indices are between 1.33306 and 1.33329, with concentrations from 0.2% to 1%. The rotation stage is set at the SPR angle of the deionized water for the sensitivity detection, and all the light intensities are the mean values for 10 s. The reflection intensities, the interference intensities, and the corresponding phase angles of the deionized water and different ethanol solutions are shown in Fig. 5. The variations of the refractive indices of the samples are , and the corresponding phase changes are 38.6°; as a result, the sensitivity of our system is . If the quasi-linear phase ranges are connected, then we can obtain the relationship between the accumulated phase angle and the SPR angle[14,31], as shown in Fig. 6. If the SPR angle of sample is known, then the accumulated phase angle from water is obtained, and we can get the final refractive index of sample by the sensitivity and the accumulated phase angle.
Figure 5.The reflection intensity, the interference intensity, and the corresponding phase angle of deionized water and different ethanol solutions with concentrations from 0.2% to 1%. The angle of the rotation stage is set at the SPR angle of the deionized water.
The deionized water, ethanol (), and dichlorom-ethane () are employed in our system to verify the large dynamic range and highly sensitive resolution of the refractive index detection. The experimental data of the deionized water, ethanol, and dichloromethane are shown in Fig. 7(a), where the deionized water is the standard sample. According to Fig. 7(a), the corresponding phase angles of the deionized water, ethanol, and dichloromethane are shown in Fig. 7(b). The experimental SPR angles of the deionized water, ethanol, and dichloromethane are 50.55°, 49.11°, and 46.35°. The refractive index of deionized water is 1.3330 and is the known sample, and the refractive indices of ethanol and dichloromethane are 1.3616 and 1.4226, according to the angular interrogation. The derivative of the phase angle[32] and the fitted data of reflectivity are obtained from the experimental data of ethanol in Fig. 7(b), and the corresponding data are shown in Fig. 8. We can see that the full width at half maximum of the derivative curve is much smaller than that of reflectivity curve. Thus, the derivative of the phase angle has a much higher resolution of the retrieved SPR angle than that of the fitted data of reflectivity, and the phase difference can be obtained from the difference value of the SPR angle between the fitted data of reflectivity and the derivative data of the phase angle. The phase difference as well as the value of sensitivity (S) is used to enhance the resolution of refractive index . Because the sensitivity is not a constant over a wide range (1.3–1.8 RIU), the sensitivity in different ranges ( in our system) should be calibrated appropriately. Based on the same method, we can obtain the final refractive index of dichloromethane.
Figure 7.(a) Reflection intensity and interference intensity of deionized water, ethanol, and dichloromethane. The markers are the experimental data, and the solid lines are the numerical fitting. (b) The corresponding phase angles (blue) at different incident angles of deionized water, ethanol, and dichloromethane. The normalized reflection intensities (black) are shown at the same time to indicate the SPR angles.
The refractive index variation from the deionized water to the 1% ethanol solution is , and the corresponding variation of the interference intensity is . The experimental interference intensity fluctuation of the deionized water is for 10 min; meanwhile, the experimental reflection intensity fluctuation of the deionized water is . The fluctuations are mainly caused by temperature drift, laser intensity noise, and the intrinsic noise of the instruments. The real limit of detection (LOD)[33] of our system is given by: The sensitivity in our system is a linear average value, and the real LOD of our system is .
We propose a new SPR refractive index sensing system that can achieve high sensitivity and a large dynamic range. According to the experimental results and the theoretical analysis, a sensitivity 7.5 of and a dynamic range of 0.5 RIU are obtained simultaneously. Both of the interference beams (- and -polarization components) pass through the same optical components, and the phase fluctuations induced by the environmental and mechanical influences are suppressed greatly. Thus, the SNR is enhanced. The new method provides a highly sensitive, wide dynamic range, high SNR, simplified structure, and gives a simple algorithm for phase-retrieval SPR refractive index sensing applications.
Guoqiang Lan, Shugang Liu, Xueru Zhang, Yuxiao Wang, Yinglin Song. Highly sensitive and wide-dynamic-range liquid-prism surface plasmon resonance refractive index sensor based on the phase and angular interrogations[J]. Chinese Optics Letters, 2016, 14(2): 022401