• Geographical Research
  • Vol. 39, Issue 8, 1879 (2020)
Jiayue WANG1、2, Liangjie XIN1、*, and Erfu DAI1
Author Affiliations
  • 1Key Laboratory of Land Surface Pattern and Simulation, Institute of Geographic Sciences and Natural Resources Research, CAS, Beijing 100101, China
  • 2College of Land Science and Technology, China Agricultural University, Beijing 100083, China
  • show less
    DOI: 10.11821/dlyj020190690 Cite this Article
    Jiayue WANG, Liangjie XIN, Erfu DAI. Spatio-temporal variations of the matching patterns of agricultural land and water resources in typical mountainous areas of China[J]. Geographical Research, 2020, 39(8): 1879 Copy Citation Text show less
    Distribution of farmland among three mountainous areas in China in 2015
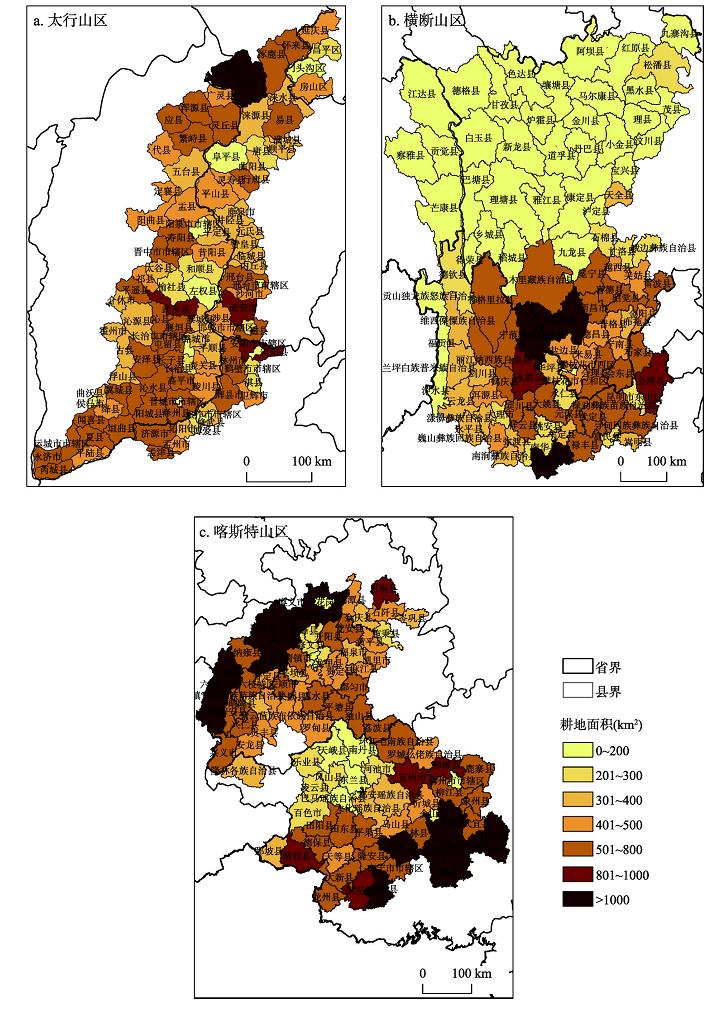
    Fig. 1. Distribution of farmland among three mountainous areas in China in 2015
    Distribution of farmland at different elevations and slope aspects among three mountainous areas in China in 2015
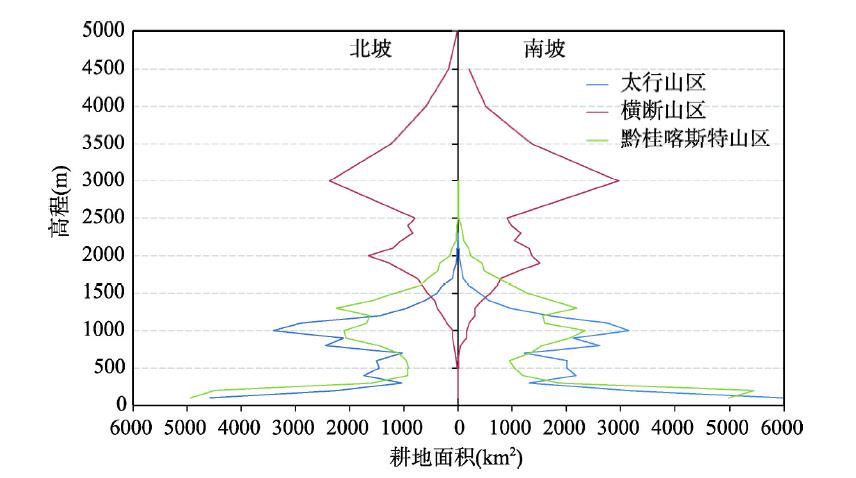
    Fig. 2. Distribution of farmland at different elevations and slope aspects among three mountainous areas in China in 2015
    Matching coefficient of agricultural soil and water resources in Taihang mountainous area
    Fig. 3. Matching coefficient of agricultural soil and water resources in Taihang mountainous area
    Matching coefficient of agricultural soil and water resources in Hengduan mountainous area
    Fig. 4. Matching coefficient of agricultural soil and water resources in Hengduan mountainous area
    Matching coefficient of agricultural soil and water resources in karst mountainous area of Guizhou and Guangxi
    Fig. 5. Matching coefficient of agricultural soil and water resources in karst mountainous area of Guizhou and Guangxi
    区域地类1990年(km2)2000年(km2)2010年(km2)2015年(km2)1990—2015年变化率(%)
    太行山区耕地61909.9661756.5762125.0860603.14-2.11
    水田633.23588.80317.84129.80-79.50
    旱地61276.7361167.7761807.2460473.34-1.31
    林地43345.1243316.7643269.9644275.322.15
    草地40965.9740179.1639549.6238646.96-5.66
    水域2558.482453.722256.362558.980.02
    城乡、工矿、居民用地11651.3812721.8513105.1714292.8722.67
    未利用土地124.30127.15249.02177.9343.15
    横断山区耕地34546.3034311.1634084.6634639.460.27
    水田7261.077297.917029.556943.50-4.37
    旱地27285.2327013.2627055.1127695.971.51
    林地202194.44201337.67206873.53201077.71-0.55
    草地190435.10191591.54185550.21190961.440.28
    水域3160.392765.993657.633483.9810.24
    城乡、工矿、居民用地806.60904.361324.531787.75121.64
    未利用土地17773.0718005.1817425.4616964.41-4.55
    黔桂喀斯特山区耕地66409.8566472.5665677.8665425.43-1.48
    水田26111.9725999.8925641.5925152.24-3.68
    旱地40297.8840472.6740036.2740273.19-0.06
    林地146496.65146246.80147332.43147534.200.71
    草地37784.1537686.0035955.2835735.17-5.42
    水域2195.872268.012648.862792.7227.18
    城乡、工矿、居民用地2946.673159.834214.314341.1147.32
    未利用土地33.3433.3437.8037.9013.67
    Table 1. Land use area statistics among three mountainous areas in China
    区域1990年2015年
    旱地林地草地水域城镇用地农村居民点其他建设用地未利用地水田
    太行山区水田15.3868.591.280.006.413.851.921.281.28
    旱地0.0293.610.170.610.601.391.811.750.04
    林地0.020.4498.740.350.130.010.070.230.01
    草地0.003.542.9092.800.100.060.170.430.01
    水域0.1516.051.081.3977.470.620.621.391.23
    城镇用地0.003.980.460.000.9290.960.922.760.00
    农村居民点0.116.691.240.220.063.0487.461.120.06
    其他建设用地0.004.690.751.690.751.881.3188.370.56
    未利用地0.002.630.002.6315.790.002.630.0076.32
    横断山区水田87.872.903.081.490.791.761.490.620.00
    旱地0.3289.374.014.950.390.160.340.410.05
    林地0.131.0394.963.360.290.010.070.060.09
    草地0.130.693.7194.170.390.010.080.070.76
    水域1.381.1912.0619.1764.430.000.000.001.78
    城镇用地3.850.000.007.690.0084.620.000.003.85
    农村居民点0.933.701.855.560.931.8583.330.001.85
    其他建设用地0.000.000.000.000.000.000.00100.000.00
    未利用地0.000.250.9412.740.220.000.000.0085.86
    黔桂喀斯特山区水田95.941.560.380.070.360.840.340.480.02
    旱地0.0896.661.360.460.310.400.090.640.00
    林地0.070.2398.720.480.250.050.020.180.00
    草地0.051.295.8792.010.320.120.030.320.00
    水域0.550.822.200.2795.330.550.000.000.27
    城镇用地0.001.280.000.001.2896.150.001.280.00
    农村居民点1.490.600.000.000.000.6097.320.000.00
    其他建设用地6.250.000.000.000.009.383.1381.250.00
    未利用地0.000.000.000.0016.670.000.0016.6766.67
    Table 2. [in Chinese]
    区域最低高程(m)最高高程(m)平均高程(m)最低坡度(°)最高坡度(°)平均坡度(°)
    太行山区范围252899927.17026.503.75
    横断山区范围-1369033307.90055.389.86
    喀斯特山区范围-705442748.98052.003.19
    太行山区水田181104124.960.037.990.44
    横断山区水田28243271651.430.0245.804.46
    喀斯特山区水田-232205574.90039.382.22
    太行山区旱地52256617.79018.121.65
    横断山区旱地19458162053.740.0154.678.08
    喀斯特山区旱地-202613789.93047.472.94
    Table 3. Terrain condition among three mountainous areas in China
    区域省份平均高程(m)2000—2005年平均水资源总量(亿m3)2000—2005年平均农业水资源量(亿m3)2012—2017年平均水资源总量(亿m3)2012—2017年平均农业水资源量(亿m3)
    太行山区河南271.6266.4141.8250.1527.71
    北京362.5519.187.8829.365.79
    河北439.0368.9122.2679.8322.26
    山西1121.4184.5850.04100.9758.65
    小计548.65239.08122.00260.31114.41
    横断山区云南2346.70914.99633.17737.11510.08
    四川2583.351907.741133.181833.531103.06
    西藏4460.24498.66112.56498.66112.56
    小计3130.103321.381878.913069.291725.70
    黔桂喀斯特山区广西363.41912.95632.111159.92780.74
    贵州1157.741008.18629.661023.54550.64
    小计760.581921.131261.772183.461331.38
    Table 4. Total water resources and agricultural water consumption among three mountainous areas in China
    Jiayue WANG, Liangjie XIN, Erfu DAI. Spatio-temporal variations of the matching patterns of agricultural land and water resources in typical mountainous areas of China[J]. Geographical Research, 2020, 39(8): 1879
    Download Citation