
Yueming Wang, Feng Xie, Jianyu Wang, "Short-wave infrared signature and detection of aicraft in flight based on space-borne hyperspectral imagery," Chin. Opt. Lett. 14, 122801 (2016)
- Chinese Optics Letters
- Vol. 14, Issue 12, 122801 (2016)
Abstract
After Malaysia plane MH370 went missing, the detection and monitoring of aircraft became a hot topic in the world. For wide coverage, space-borne instruments are expected to play an important role. The signatures of aircraft are very complex because they are relevant to the type of aircraft, flight altitude, etc. Many investigations on aircraft’s infrared signatures were conducted in the past decades. Most of them focused on the mid-wave infrared and long-wave infrared spectral regions for the application of missile guidance or countermeasures. Few of them paid attention to the signature in short-wave infrared (SWIR) spectral region. Generally speaking, higher resolutions can be achieved with same aperture diameters in the SWIR spectral region. To study the SWIR signature of aircraft, hyperspectral imaging technology is a useful tool. Hyperspectral imaging sensors are currently one of the most evolving and most promising technologies. Traditionally, hyperspectral imagery is used for earth science, mineral exploitation, etc. Classification utilizing hyperspectral data has been implemented extensively[
The Tiangong-1 spacecraft was launched in 2011. The height of its orbit is about 400 km. A high-resolution SWIR hyperspectral imager is aboard in the spacecraft. It is a prismatic hyperspectral imager with high sensitivity in the SWIR bands. The main specifications are shown in Table
| Item | Specification |
|---|---|
| Spectral range (nm) | 900–2500 |
| Spectral interval (nm) | 23.5 |
| Band number | 68 |
| Ground sample distances (m) | 20@400 km |
| Swath (km) | 10@400 km |
| SNR ( | 180@1700 nm; 120@2200 nm |
| Radiometric Calibration Accuracy | |
| Spectral Calibration Accuracy (nm) |
Table 1. Main Specifications of SWIR Hyperspectral Imager
They are both Boeing 737-sized aircrafts. One is southeast of Australia, and the other is in Malaysia. The pansharpened images are shown in Figs.
Sign up for Chinese Optics Letters TOC. Get the latest issue of Chinese Optics Letters delivered right to you!Sign up now
![]()
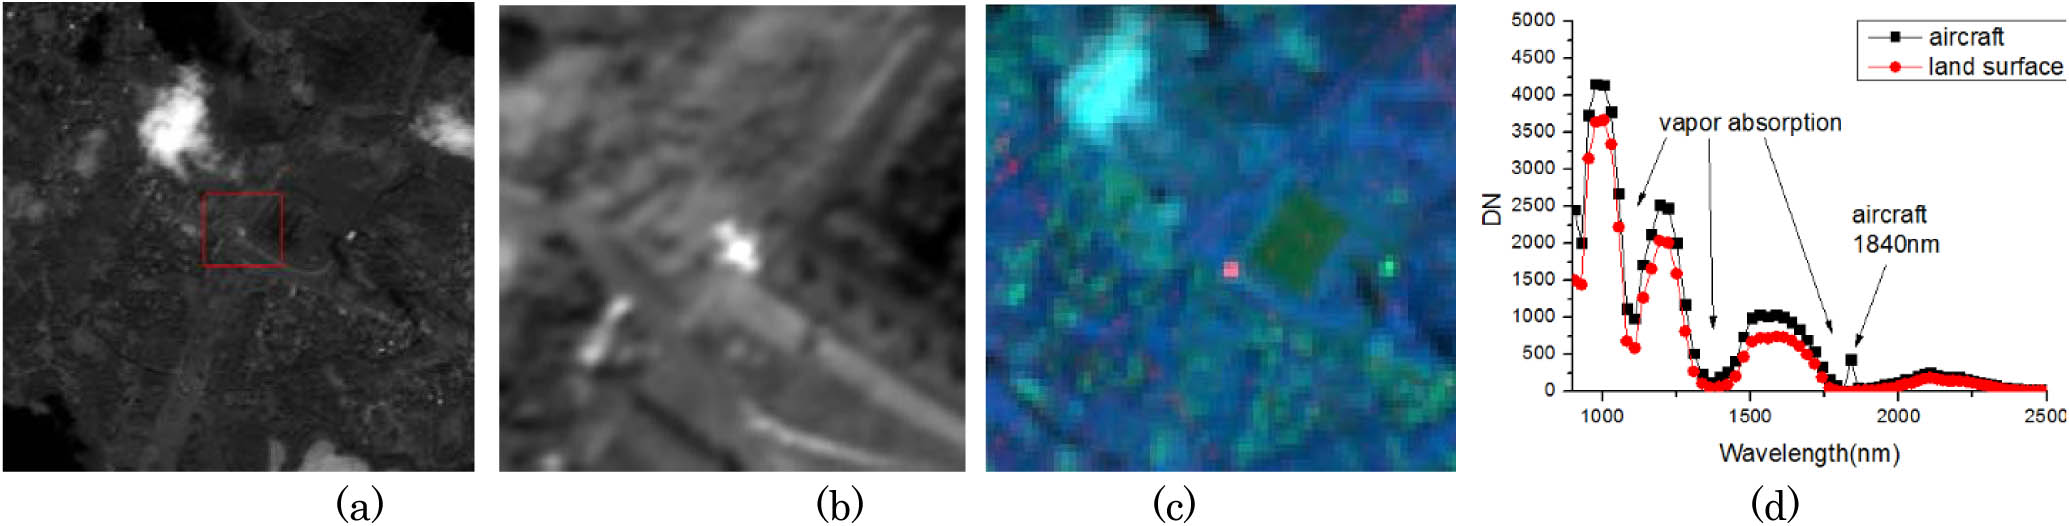
Figure 1.Aircraft in 5 m pansharpened image in Malaysia. (a) Pansharpened image, (b) zoomed-in pansharpened image, (c) false RGB of SWIR, and (d) spectral curve of aircraft and clutter.
![]()
Figure 2.Aircraft in 5 m pansharpened image in Australia. (a) Pansharpened image, (b) Zoomed-in pansharpened image, (c) false RGB of SWIR, and (d) spectral curve of aircraft and clutter.
Figures
Due to reflectance of solar irradiance, the two aircraft are both bright in the pansharpened images. The shapes of the aircrafts in the pansharpened image are clear. In Fig.
On the basis of the signature analysis in the SWIR spectral region, we can discuss the capability of SWIR hyperspectral imagery for aircraft detection. The distinct advantage is the reflectance spike at the 1840 nm band. The signal can provide a high signal-to-clutter ratio (SCR) for target detection. Figure
![]()
Figure 3.Grayscale distributions of two band images. (a) 1700 nm band and (b) 1840 nm band.
The RX algorithm is a classic detector for hyperspectral anomaly detection. It is a basic multivariate anomaly detector[
Experiment 1: only two vapor absorption bands (1137 and 1395 nm) and 1840 nm bands are used in the calculation.
Experiment 2: four bands in atmospheric window are added in. They are 1029, 1221, 1612, and 2204 nm.
Experiment 3: all 68 bands are used in the calculation of the RX anomaly detection.
The Ground sample distances (GSDs) of the images used for experiments are the same, 20 m.
The RX anomaly detection results of the image data corresponding to Figs.
![]()
Figure 4.RX anomaly detection result of data in Fig.
![]()
Figure 5.RX anomaly detection result of data in Fig.
A large-area focal plane array and large aperture optics are the two main factors of the high cost of space-borne instruments. If we can detect the aircraft with a lower-resolution instrument, that means a lower cost to manufacture the instruments. We also carried out an experiment to analyze the result of the RX anomaly detection when the pixels were binning. The spatial resolutions were 40 and 80 m. The data source is same as that shown in Fig.
Comparing with Fig.
![]()
Figure 6.Experiment result of lower spatial resolution. (a) 40 and (b) 80 m.
![]()
Figure 7.Relationship between GSD and SCR.
In conclusion, the infrared spectral signature of an aircraft is clear when it flies at high altitudes. The signature mainly comes from less absorption in the vapor absorption bands. When the aircraft flies higher, the signature will be stronger. The RX anomaly detection algorithm is effective for the detection of aircraft based on SWIR hyperspectral imagery. Band selection plays a key role for maximizing the SCR of the detection. The spatial resolution is one important factor for detection probability. Trade-offs should be considered among all the factors, such as spatial resolution, cost, revisit period, etc.
References
[1] C. Liu, Z. Han, T. Xie. Chin. Opt. Lett., 13, 071701(2015).
[2] Q. Yang. Chin. Opt. Lett., 12, 031201(2014).
[4] J. Karlholm, I. Renhorn. Appl. Opt., 41, 6786(2002).
[5] S. Lefebvre, A. Roblin, V. G. Durand. Reliab. Eng. Syst. Saf., 95, 484(2009).
[6] Y. Ata, K. C. Nakiboglu. Opt. Commun., 283, 3901(2010).
[7] W. A. Hovis, L. R. Blaine, M. L. Forma. Appl. Opt., 9, 561(1970).
[8] F. Liu, X. Shao, P. Han, B. Xiangli, C. Yang. Opt. Eng., 53, 094101(2014).
[9] H. Li, Y. Ma, K. Liang, Y. Yu. Chin. Opt. Lett., 10, 013001(2012).
[10] P. Du, W. Zhang, J. Xia. Chin. Opt. Lett., 9, 031002(2011).
[11] I. S. Reed, Y. Xiaoli. IEEE Trans. Acoust., Speech, Signal Process., 38, 1760(1990).


Set citation alerts for the article
Please enter your email address

© Copyright 2018-2021 | Chinese Laser Press. All Rights Reserved 沪ICP备15018463号-20