
Bin Wu, Xu-dong Wang, Xiao-fei Gao, Hao Li, Shan Xi Tian. Dissociative Electron Attachment to Carbon Dioxide†[J]. Chinese Journal of Chemical Physics, 2020, 33(5): 521
- Chinese Journal of Chemical Physics
- Vol. 33, Issue 5, 521 (2020)
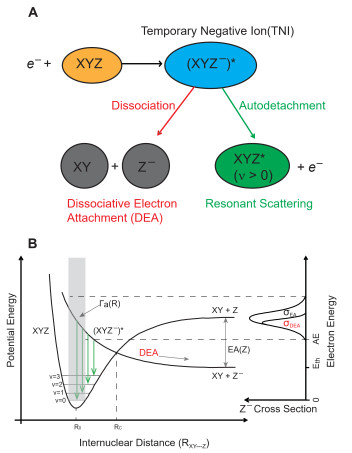
Fig. 1. (A) Two typical pathways after electron attachment to XYZ and Morse potential curves of XYZ and XYZ- (left) and (B) differential cross sections of $\sigma_{\rm{EA}}$ and $\sigma_{\rm{DEA}}$ (right).
![(A) O- and (B) C- production efficiency curves of the DEA to CO2 (reproduced from [32, 34]).](/richHtml/cjcp/2020/33/5/05000521/img_2.jpg)
Fig. 2. (A) O- and (B) C- production efficiency curves of the DEA to CO2 (reproduced from [32, 34]).
Fig. 3. Schematics of our (A) low- and (B) high- resolution VMI apparatuses.
Fig. 4. High-resolution O- velocity images of the DEAs to CO2 at the electron energies of (A) 4.15, (B) 4.55, and (C) 4.95 eV. The electron incident direction (along y axis) is from top (backward) to bottom (forward) and through the image center.
Fig. 5. Assignments with the rotational states $j$=0-25 of CO ($X^1\Sigma^+$, $v$=0) of the O- kinetic energy distributions in the forward (A, $\theta$ from -15° to 15°) and backward (B, $\theta$ from -165° to 165°) scattering directions. The solid circles are the relative intensities of O- ions observed in FIG. 4(A) , the vertical lines show the intensities of different rotational states, and the red curves show the fitting profiles of all rotational states considered here. In the data fittings, a gaussian function with an energy width of 0.03 eV is used for each rotational state.
Fig. 6. Angular distributions of O- ions produced in the DEA to CO2 at 4.15 eV. The co-product CO ($X^1\Sigma^+$, $v$=0) is populated at different rotational states ($j$).
Fig. 7. Renner-Teller split states coupling with the dissociation pathway in Franck-Condon region of electron attachment (A). Time-sliced O- velocity images of the DEA to CO2 are recorded at electron energies of 7.7 eV (B), 8.2 eV (C), and \mbox{8.7 eV} (D) \cite{28}. The electron incident direction (along $x$ aix) is from left (backward) to right (forward) and through the image center.
Fig. 8. High-resolution O- image (A) and the O- kinetic energy distribution (B) for the DEA to CO2 at the electron energy of 13 eV. In (A), the electron incident direction (along the $y$ axis) is from top (backward) to bottom (forward) and through the image center.
Fig. 9. Three-dimensional image of C- of the DEA to CO2 at the electron energy of 15.9 eV. The red circle is the demarcation of three-body dissociation and two-body dissociation.
Fig. 10. (A) Daytime photoelectrons spectrum in the Earth ionosphere (reproduced from [84]), in which each line represents a different height. (B) Energy spectra of oversampled photoelectrons in the Martian ionosphere, where the electron flows toward and away from Mars are marked in red and green respectively (reproduced from [85]). The vertical bars shaded in blue correspond to the electron energy range investigated in the DEA study [27].
Fig. 11. (A) Energetics comparison between the neutral dissociation and DEA processes of CO2. (B) Surface catalytic processes of CO2.

Set citation alerts for the article
Please enter your email address
© Copyright 2018-2021 | Chinese Laser Press. All Rights Reserved 沪ICP备15018463号-20