
Xiaoyan LIU, Suzhen DANG, Changming LIU, Guotao DONG. Effects of rainfall intensity on the sediment concentration in the Loess Plateau, China[J]. Journal of Geographical Sciences, 2020, 30(3): 455
- Journal of Geographical Sciences
- Vol. 30, Issue 3, 455 (2020)
Abstract
1 Introduction
The sediment concentration (kg/m3), sediment load (t), discharge (m3/s) and flood volume (m3) are the main characteristic indexes of floods in the Loess Plateau. The sediment concentration is not only the characteristic index of flooding and the key parameter for calculation of the sediment load but is also a characteristic index of the sediment-yield intensity together with the sediment transport modulus (t/km2); this latter parameter constitutes the characterization index of sediment yield in the basin and has attracted much attention.
At present, research on the sediment concentration in the Loess Plateau mainly involves three aspects: (i) the formation and transport processes of the hyperconcentrated flow (
In terms of the relationship between the rainfall intensity and sediment concentration, previous studies have mostly reported laboratory test results (
Previous studies have concluded that a larger rainfall intensity led to a higher sediment concentration; however, explaining the phenomenon depicted in
![]()
Figure 1.Figure 1
2 Study area and data
Wuding River is a first-order tributary of the Yellow River. The study area is located in the middle of the Loess Plateau.
| Subwatershed | Small watershed | |||||||||
|---|---|---|---|---|---|---|---|---|---|---|
| Tuanshangou | Shuiwanggou | Tuan- yuangou | Qiaogou | Peijiamao | Liujiagou | Shejiagou | ||||
| Area (km2) | 0.18 | 0.107 | 0.491 | 0.44 | 39.5 | 21.0 | 4.72 | |||
| Period (years) | 1961-1969 | 1959-1967 | 1958-1961 | 1990-1997 | 2007-2018 | 1990-1997 | 2007-2018 | 1960-1969 | 1963-1969 | |
| Vegetation coverage (%) | 10-30 | 36-47 | 55-75 | 36-47 | 55-75 | 10-30 | ||||
Table 1.
The characteristic values of the selected watersheds
![]()
Figure 2.Figure 2
The observed subwatershed data were collected from Tuanshangou, Shuiwanggou, Tuanyuangou and Qiaogou, whereas the small watershed data were collected from Peijiamao, Liujiagou and Shejiagou. The small watershed system is composed of many subwatersheds. The Tuanyuangou and Qiaogou subwatersheds are located in the Jiuyuangou and Peijiamao watersheds, respectively.
On the runoff plot scale, the observation data were obtained from the No. 2-9 runoff plots in the Tuanshangou subwatershed and the Duanchuan 1 and Duanchuan 2 runoff fields in the Shuiwanggou subwatershed (
| Runoff plots located at an upper hillslope | Runoff plots composed of hillslope and valley side slope (entire slope) | |||||||
|---|---|---|---|---|---|---|---|---|
| No. 2 | No. 3 | No. 4 | No. 5 | Duanchuan 1 | Duanchuan 2 | No. 7 | No. 9 | |
| Slope length (m) | 40 | 60 | 20 | 20 | 7.57 | 20.1 | ||
| Area (m2) | 647 | 970 | 324 | 350 | 31.5 | 208 | 17200 | 4580 |
Table 2.
Overview of the runoff plots
The sample floods selected in this paper are all floods recorded during the selected period. The rainfall, runoff and sediment data are from the hydrological data of the Zizhou Runoff Experimental Station in the Yellow River Basin and the Runoff and Sediment Test Data of Soil and Water Conservation in the Middle Reaches of the Yellow River published by the Upper and Middle Yellow River Bureau, Yellow River Conservancy Commission.
Rainfall intensity refers to rainfall in a unit of time in mm/min or mm/h. For the runoff plots and subwatersheds, we selected the maximum rainfall in 1 min (I1min) and maximum rainfall in 5 mins (I5min) before the occurrence of the sand peak as the maximum rainfall intensity (Imax) of the corresponding sand peak. In the rainfall records for the data collection period, we found that the minimum step size of rainfall was mostly in hours at the small watershed scale, although a few rainfalls were recorded in minutes; however, the step size was uneven. In view of this issue, this paper also chose maximum rainfall in 1 h (I1h) as the characteristic index of Imax for small watersheds. The data processing method is as follows: (1) when the rainfall lasted more than 1 h and the maximum 1 h rainfall could be obtained directly, the maximum 1 h rainfall before or covering the occurrence of the sand peak was taken as Imax corresponding to the sand peak; (2) when the rainfall duration was less than 45 mins, the flood was not selected to avoid disturbance of the sediment concentration caused by the gully bed during flood evolution; and (3) if the rainfall duration was more than 45 mins but less than 1 h, the measured rainfall intensity was magnified in proportion, and the hourly rainfall intensity was calculated as Imax.
For subwatersheds with a drainage area of less than 0.5 km2 and 6-8 rainfall stations, Imax is the average of the maximum 1 h rainfall of each rainfall station in the subwatershed. By analyzing the measured data from the Chabagou watershed from 1959 to 1969, we found that the sediment concentration of a medium hyperconcentrated flood in any subwatershed with no dam or reservoir to intercept sand could almost completely represent the sediment concentration in the small watershed outlet. In view of this finding, Imax is the maximum value of the maximum 1 h rainfall of each rainfall station for small watersheds.
Using the Global Inventory Modeling and Mapping Studies (GIMMS) NDVI dataset (NDVI3g, v1.0), the Normalized Difference Vegetation Index (NDVI) of Peijiamao and Qiaogou from 1990-1997 and 2007-2018 was extracted to obtain vegetation coverage information.
3 The relationship between the sediment concentration and rainfall intensity on the plot scale
![]()
Figure 3.Figure 3
However, the relationship between PSC and Imax shown in
![]()
Figure 4.Figure 4
4 The relationship between the sediment concentration and rainfall intensity on the basin scale
The natural slope gully plot can be regarded as the lowest level of the drainage area, whereas the subwatershed is a higher level.
![]()
Figure 5.Figure 5
The vegetation of the Qiaogou subwatershed in the 1990s was much better than that before the 1960s, and the rainfall intensity threshold was 17-20 mm/h, which was obviously larger than that of Tuanyuangou, which is adjacent to Qiaogou, in 1956-1961; when the rainfall intensity is larger than this threshold, the PSC is also significantly lower than that of Tuanshangou. After 2007, the annual precipitation with daily rainfall greater than 25 mm was 30% higher than that in the 1990s at the Qiaogou subwatershed. However, due to further improvement of the vegetation, the frequency of rainfall that caused runoff decreased from an average of 6-7 times per year in the 1990s to less than once per year after 2007, the maximum sediment concentration was reduced by approximately 50% and the rainfall intensity threshold probably exceeded 40 mm/h. However, more verification is needed in the future.
On the small watershed scale with a larger area, as shown in
![]()
Figure 6.Figure 6
The rainfall intensity thresholds obtained from the Tuanguangou, Tuanshangou and Shuiwanggou subwatersheds in the 1950s and 1960s were also similar to the standard of erosive rainstorms proposed by others (
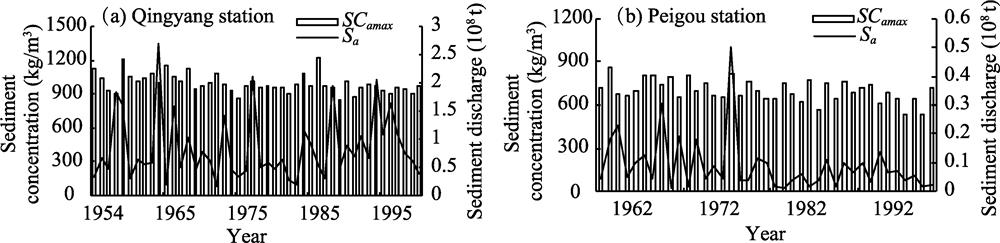
Rainfall during flood season on the Loess Plateau is mostly local rainstorms with a small coverage area. Therefore, for large- and medium-sized river basins, the corresponding relationship between the rainfall intensity and sediment concentration will be disturbed due to the low density of rainfall stations coupled with the influence of the water flow propagation time and riverbed environment on evolution of the flow with sediment. However, according to analysis of the upper reaches of the Malian River (
5 Discussion
5.1 Comparisons with similar studies
Phenomena similar to those shown in Figures 3-6 have been found in other studies. Wang et al. discovered the existence of an extreme sediment concentration in the hyperconcentrated flow of the Loess Plateau (
The sediment-carrying capacity of the overland flow has become a research hotspot in recent years (
![]()
Figure 7.Figure 7
![]()
Figure 8.Figure 8
Notably, the sediment concentration of a flood will not increase significantly when the rainfall intensity is larger than the rainfall intensity threshold obtained in this paper, since the sediment discharge in the basin is a function of the discharge, sediment concentration and flood duration. However, because the discharge increases with the increasing rainfall intensity (
![]()
Figure 9.Figure 9
5.2 The influence of the underlying surface on the rainfall intensity threshold and maximum sediment concentration
Dam and reservoir sediment retention and vegetation coverage are also important factors affecting the sediment concentration of floods (
Taking the subwatershed as an example, the average forest and grassland vegetation coverage in the Qiaogou subwatershed from 1990-1997 and 2007-2018 was 36%-47% and 55%-75%, respectively (
The rainfall intensity threshold and maximum sediment concentration of Tuanyuangou from 1956-1961 were 10-15 mm/h and 780 kg/m3, respectively. In the 1960s, the rainfall intensity threshold and maximum sediment concentration of Tuanshangou and Shuiwanggou were 15 mm/h and 760 kg/m3, respectively. The rainfall intensity threshold and maximum sediment concentration of Qiaogou in the 1990s were 17-20 mm/h and 507 kg/m3, respectively. From 2007 to 2018, the rainfall intensity threshold of Qiaogou may have exceeded 40 mm/h, whereas the maximum sediment concentration has not exceeded 400 kg/m3. No check dams and terraces are located in these areas, and therefore the change in the rainfall intensity threshold is obviously caused by vegetation changes.
For the subwatersheds, during the analysis periods of the different watersheds, the vegetation coverage was highest, the rainfall intensity threshold was largest, and the maximum sediment concentration was smallest at Qiaogou. For the Qiaogou subwatershed, the vegetation coverage in 2007-2018 was higher than that in 1990-1997, the rainfall intensity threshold increased and the maximum sediment concentration decreased.
During the same period, the vegetation coverage of the Peijiamao watershed and Qiaogou subwatershed were the same (
5.3 Causes of extreme sediment concentrations
The Loess Plateau is the main source of sediment in the Yellow River. The study area of this paper is located in the middle and lower reaches of the Wuding River. According to a remote sensing survey (
![]()
Figure 10.Figure 10
![]()
Figure 11.Figure 11
In addition to the frequency characteristics of the rainfall intensity, the unique sediment supply mode may also be the cause of the extreme sediment concentration phenomenon.
Flows with sediment transported in the main stream of the Yellow River and its larger tributaries allocated sediment when entering the river channel. Therefore, there is a feature that “the greater the flow, the more sediment that can be carried”. However, in the Loess Plateau, although the sediment concentration in the small watershed in the 1960s could reach approximately 1100 kg/m3, generally the sediment concentration of the raindrops was not more than 200-300 kg/m3 (
The above analysis shows that forest and grass vegetation changes are not significant at the watershed scale due to rainfall with a rainfall intensity greater than 15 mm/h, which occurred almost every year from the 1950s to the 1980s (
6 Conclusions
The relationship between Imax and PSC at different spatial scales was analyzed based on more than 1300 sets of measured rainfall and flood data from runoff plots located at an upper hillslope, natural slope gully plots, subwatersheds with an area less than 0.5 km2 and small watersheds with an area of 4.7-40 km2 in the Loess Plateau. The results were as follows:
(1) At the upper hillslope scale, the sediment concentration generally increases with the increasing rainfall intensity. However, at the watershed scale with both slopes and gullies, an obvious threshold exists for the influence of rainfall intensity on the sediment concentration regardless of the watershed level or area. When the rainfall intensity exceeds this threshold, an increasing rainfall intensity does not further increase the sediment concentration.
(2) The rainfall intensity threshold is also different in different underlying surface areas. Taking the subwatershed as an example, the rainfall intensity threshold was approximately 10-15 mm/h for Tuanyuangou in 1956-1961, 15 mm/h for Tuanshangou and Shuiwanggou in the 1960s, and 17-20 mm/h for the Qiaogou subwatershed in the 1990s and may have exceeded 40 mm/h in 2007-2018. No check dams and terraces are located in these areas, and thus the changes in the rainfall intensity thresholds are obviously caused by vegetation changes. During the same period, the rainfall intensity threshold of the Peijiamao basin was slightly larger than that of the Qiaogou subwatershed as a result of the check dam.
(3) The threshold of the rainfall intensity increases with the increasing watershed level. For example, generally the rainfall intensity threshold of Tuanshangou is larger than that of the No. 7 and No. 9 runoff plots in Tuanshangou. The rainfall intensity threshold of Peijiamao is also larger than that of Qiaogou, because the sediment transport resistance is greater at higher basin levels. As the resistance increases, the sediment concentration also decreases with the increasing basin level. According to statistics from 26 floods in Shejiagou from 1963 to 1969, the average sediment concentrations were 670 kg/m3 and 690 kg/m3 for the No. 7 and No. 9 runoff plots in Tuanshangou, respectively, 634 kg/m3 for the Tuanshangou subwatershed, and only 585 kg/m3 for Shejiagou.
(4) When the rainfall intensity exceeds the rainfall intensity threshold, the maximum sediment concentration of each region is also different. The average sediment concentrations were 780 kg/m3 for Tuanshangou, 760 kg/m3 for Tuanshangou and Shuiwanggou, and 507 kg/m3 for Qiaogou in the 1990s but never exceeded 400 kg/m3 after 2007. This phenomenon is mainly related to forest and grass vegetation coverage, with higher vegetation coverage leading to a lower flood sediment concentration.
The rainfall intensity threshold phenomenon that is revealed in this study not only explains the small change in the sediment concentration in the second half of the 20th century but also has important reference significance for the scientific and reasonable selection of rainfall factors in the hydrological method (a method used to analyze the causes of runoff and sediment changes in the basin). Additionally, our results provide scientific support for the objective understanding of the sediment production situation in the Loess Plateau under extreme heavy rainfall.
References
[1] O Cerdan, Y L Bissonnais, V Souchère et al. Sediment concentration in interrill flow: Interactions between soil surface conditions, vegetation and rainfall. Earth Surface Process and Landforms, 27, 193-205(2002).
[2] Haiyan Fang, Liying Sun, Zhenghong Tang. Effects of rainfall and slope on runoff, soil erosion and rill development: An experimental study using two loess soils. Hydrological Processes, 29, 2649-2658(2015).
[3] Xiaoming Feng, Bojie Fu, Sshilong Piao et al. Revegetation in China’s Loess Plateau is approaching sustainable water resource limits. Nature Climate Change, 6, 1019-1022(2016).
[4] Guangyao Gao, Bojie Fu, Jianjun Zhang et al. Multiscale temporal variability of flow-sediment relationships during the 1950s-2014 in the Loess Plateau, China. Journal of Hydrology, 563, 609-619(2018).
[5] Jijun He, Liying Sun, Huili Gong et al. Laboratory studies on the influence of rainfall pattern on rill erosion and its runoff and sediment characteristics. Land Degradation & Development, 28, 1615-1625(2017).
[6] Jianhua Liao, Danxun Li, Xingkui Wang et al. Comparative analysis of spatial distribution between the specific sediment yield and the hyperconcentrated flow frequency in the Loess Plateau. Journal of Natural Resources, 25, 100-111(2010).
[7] Xiaoyan Liu. Causes of Sharp Decrease in Water and Sediment in Recent Years in the Yellow River, 11-24(2016).
[8] Xiaoyan Liu, Yunfei Gao, Sanbao Ma et al. Sediment reduction of warping dams and its timeliness in the Loess Plateau. Journal of Hydraulic Engineering, 49, 145-155(2018).
[9] Xiaoyan Liu, Shengtian Yang, Xiaoyu Li et al. The current vegetation restoration effect and its influence mechanism on the sediment and runoff yield in severe erosion area of Yellow River Basin. Scientia Sinica (Technologica), 45, 1052-1059(2015).
[10] T Nishigaki, S Sugihara, M Kilasara et al. Surface runoff generation and soil loss under different soil and rainfall properties in the Uluguru Mountains, Tanzania. Land Degradation & Development, 28, 283-293(2017).
[11] Keli Tang. Soil and Water Conservation in China, 41-46(2004).
[12] Dongdong Wang, Zhanli Wang, Qingwei Zhang et al. Experiment on influence of cover degree, slope and rainfall intensity on sediment concentration of slope runoff in rangeland. Transactions of the Chinese Society of Agricultural Engineering (Transactions of the CSAE), 33, 119-125(2017).
[13] Xingkui Wang, Ning Qian, Weide Hu. The formation and process of confluence of the flow with hyperconcentration in the gullied-hilly loess areas of the Yellow River Basin. Journal of Hydraulic Engineering, 28-37(1982).
[15] Jiongxin Xu. Physico-geographical factors for the formation of hyperconcentrated flows in the Loess Plateau of China. Acta Geographica Sinica, 54, 318-326(1999).
[16] Jiongxin Xu. Sediment-heavily containing flows in slope-channel systems of gullied hilly area in the Loess Plateau (Ι): Influences of landforms and gravitational erosion. Journal of Natural Disasters, 13, 55-60(2004).
[17] Cuiping Zhang, Linjuan Xu, Shimin Tian et al. Impact of rainfall intensity on flood sediment concentration in Malian River. Yellow River, 39, 66-70(2017).
[18] Guanghui Zhang. Several understandings for sediment transport capacity by overland flow. Advances in Water Science, 29, 151-158(2018).
[19] Jianjun Zhang. Summary of studies on sediment carrying capacity of surface runoff on loess slopes. Journal of Sediment Research, 77-80(2007).
[20] Keli Zhang. A study on the distribution of erosion and sediment yield on loess slope and the relationship between the distribution and rain characteristics. Journal of Sediment Research, 39-46(1991).
[21] Ruibo Zhang, Liping Zhang, Xingtao Fu. Research on the dynamic processes of sediment concentrations in slope runoff with rainfall intensity and slope length. Journal of Soil and Water Conservation, 32, 80-84(2018).
[22] Xusheng Zhang, Tianzhu Xue, Can Ma et al. Impacts of rainfall intensity and grass coverage on runoff and sediment yield on typical sloping land. Journal of Arid Land Resources and Environment, 26, 66-70(2012).
[23] Guangju Zhao, Xiaoli Yue, Peng Tian et al. Comparison of the suspended sediment dynamics in two Loess Plateau catchments, China. Land Degradation & Development, 28, 1398-1411(2017).
[24] Mingguo Zheng, Qiangguo Cai, Hao Chen. Effect of vegetation on runoff-sediment yield relationship at different spatial scales in hilly areas of the Loess Plateau, North China. Acta Ecologica Sinica, 27, 3572-3581(2007).
[25] Mingguo Zheng, Ruikun Li, Jijun He. Sediment concentrations in run-off varying with spatial scale in an agricultural subwatershed of the Chinese Loess Plateau. Hydrological Processes, 29, 5414-5423(2016).
[26] Mingguo Zheng, Fen Qin, Liying Sun et al. Spatial scale effects on sediment concentration in runoff during flood events for hilly areas of the Loess Plateau, China. Earth Surface Processes & Landforms, 36, 1499-1509(2011).
[27] Peihua Zhou, Zhanli Wang. Soil erosion storm rainfall standard in the Loess Plateau. Bulletin of Soil and Water Conservation, 38-44(1987).


Set citation alerts for the article
Please enter your email address

© Copyright 2018-2021 | Chinese Laser Press. All Rights Reserved 沪ICP备15018463号-20