
Hongkang Huang, Xia Luo, Yuhong Dai, Xin He, Yunzhong Liu, Bensheng Huang, Zhou Fan. Parameters and Microstructure Evolution of TiC/TC4 Composites Formed by Selective Laser Melting[J]. Chinese Journal of Lasers, 2024, 51(16): 1602301
- Chinese Journal of Lasers
- Vol. 51, Issue 16, 1602301 (2024)
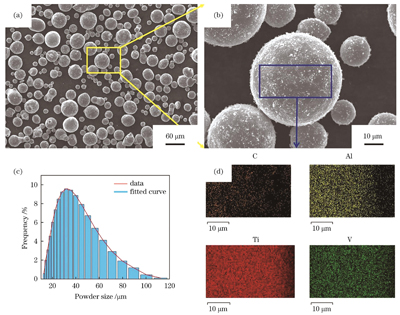
Fig. 1. SEM and EDS images of composite powder. (a)(b) SEM images of powder; (c) size distribution of composite powder particles; (d) EDS images of powder
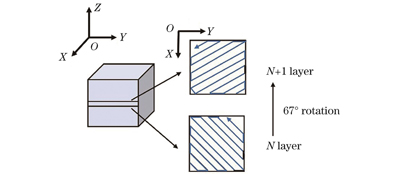
Fig. 2. Scanning strategy
Fig. 3. Influence of volume energy density on forming quality and relative density. (a) Relationship between forming quality and volume energy density; (b) relationship between relative density and volume energy density
Fig. 4. Metallographic pictures of formed samples at different volume energy density values (before corrosion). (a)‒(c) Cross section; (d)‒(f) longitudinal section
Fig. 5. XRD pattern of formed samples at different volume energy density values. (a) XRD pattern; (b) standard 2θ location of α-Ti
Fig. 6. Metallographic pictures of formed samples at different volume energy density values (after corrosion). (a)‒(d) Cross section; (e)‒(h) longitudinal section
Fig. 7. SEM images and local magnification images of SLM formed samples at different volume energy density values. (a)‒(l) Cross section; (m)‒(t) longitudinal section
Fig. 8. High magnification SEM images of SLM formed samples at different volume energy density values. (a)‒(d) Cross section; (e)‒(h) longitudinal section
Fig. 9. Effect of volume energy density on micro-hardness of TiC/TC4 composites
Fig. 10. EBSD analysis results. (a)‒(c) Cross-section IPF; (d)‒(f) longitudinal section IPF
Fig. 11. EBSD analysis results. (a)(b) Band contrast diagrams; (c)(d) phase diagrams
Fig. 12. EBSD results of sample when volume energy density of 85 J/mm3. (a) Longitudinal section IPF; (b) polar diagrams of β-Ti and α-Ti; (c) polar diagrams of β-Ti, α-Ti, and TiC at grain boundary; (d) polar diagrams of transgranular TiC and α-Ti
Fig. 13. Microstructure evolution diagrams of TiC/TC4 in cross-sectional and longitudinal sections. (a)(b) Diagrams of powder melting; (c)(d) schematics of cross section; (e)(f) schematics of longitudinal section
|
Table 1. Orthogonal experimental parameters of TiC/TC4 composites

Set citation alerts for the article
Please enter your email address
© Copyright 2018-2021 | Chinese Laser Press. All Rights Reserved 沪ICP备15018463号-20