• High Power Laser Science and Engineering
  • Vol. 10, Issue 1, 010000e2 (2022)
C. Y. Qin1、2, H. Zhang1、3、*, S. Li1, S. H. Zhai4, A. X. Li1、5, J. Y. Qian1, J. Y. Gui1, F. X. Wu1, Z. X. Zhang1, Y. Xu1、3, X. Y. Liang1、3, Y. X. Leng1、3, B. F. Shen1、4、*, L. L. Ji1、3、*, and R. X. Li1、3、5
Author Affiliations
  • 1State Key Laboratory of High Field Laser Physics, Shanghai Institute of Optics and Fine Mechanics, Chinese Academy of Sciences, Shanghai201800, China
  • 2Center of Materials Science and Optoelectronics Engineering, University of Chinese Academy of Sciences, Beijing100049, China
  • 3CAS Center for Excellence in Ultra-intense Laser Science, Shanghai201800, China
  • 4Department of Physics, Shanghai Normal University, Shanghai200234, China
  • 5ShanghaiTech University, Shanghai201210, China
  • show less
    DOI: 10.1017/hpl.2021.54 Cite this Article Set citation alerts
    C. Y. Qin, H. Zhang, S. Li, S. H. Zhai, A. X. Li, J. Y. Qian, J. Y. Gui, F. X. Wu, Z. X. Zhang, Y. Xu, X. Y. Liang, Y. X. Leng, B. F. Shen, L. L. Ji, R. X. Li. Mapping non-laminar proton acceleration in laser-driven target normal sheath field[J]. High Power Laser Science and Engineering, 2022, 10(1): 010000e2 Copy Citation Text show less
    Sketch of the experimental setup (a) without the knife edge and (b) with the knife edge. (c) The typical proton energy spectrum of 10-μm aluminum detected by a Thomson parabolic spectrometer in a separate run. The laser pulse with 1.8 × 10²⁰ W/cm2, 35 fs, 12 μm (beam size) and 10–6@3 ns irradiates a 10-μm-thick aluminum foil at 20° incident angle.
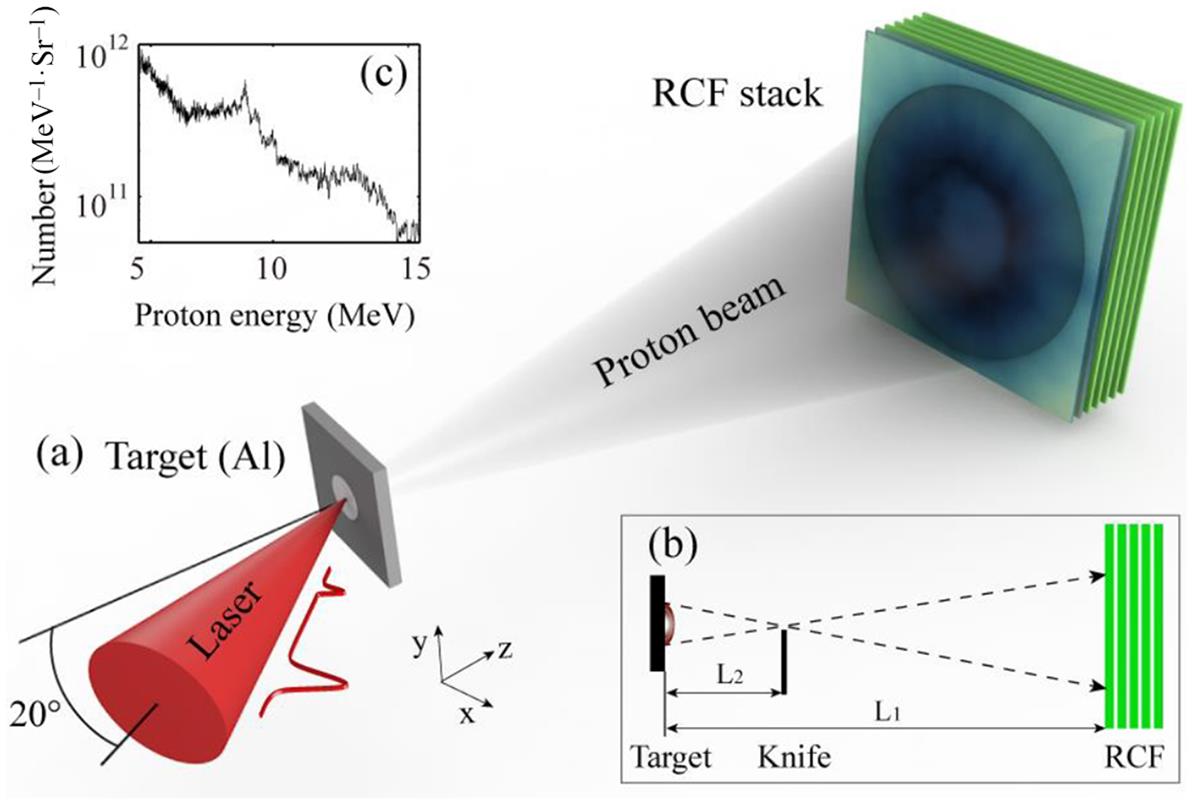
    Fig. 1. Sketch of the experimental setup (a) without the knife edge and (b) with the knife edge. (c) The typical proton energy spectrum of 10-μm aluminum detected by a Thomson parabolic spectrometer in a separate run. The laser pulse with 1.8 × 10²⁰ W/cm2, 35 fs, 12 μm (beam size) and 10–6@3 ns irradiates a 10-μm-thick aluminum foil at 20° incident angle.
    (a1)–(a4) The proton beam profiles of different energy on RCF without knife edge and (b1)–(b4) proton beam profiles of different energy on RCF with a knife edge. (c) The dose distribution along the dashed lines in (a1)–(a4). (d) The OD distribution in the white dashed rectangle in (b2). The red/blue parts denote the area irradiated/non-irradiated by protons and the transition between (yellow–green) is the penumbra region.
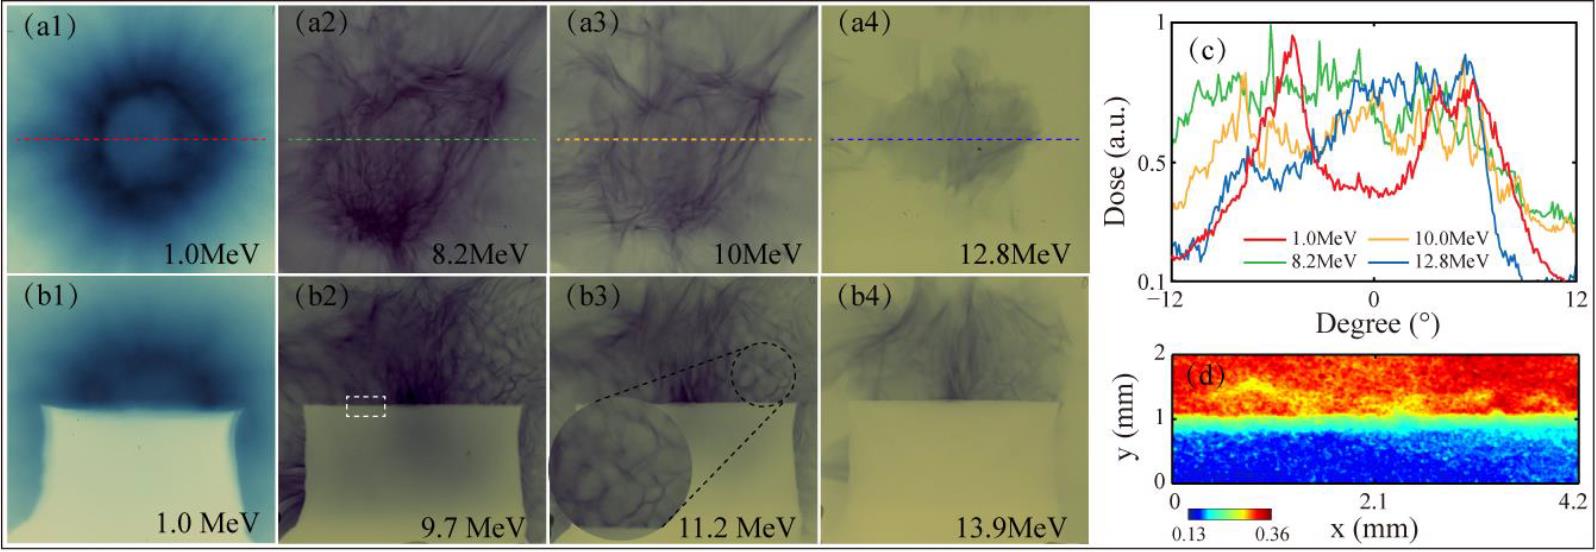
    Fig. 2. (a1)–(a4) The proton beam profiles of different energy on RCF without knife edge and (b1)–(b4) proton beam profiles of different energy on RCF with a knife edge. (c) The dose distribution along the dashed lines in (a1)–(a4). (d) The OD distribution in the white dashed rectangle in (b2). The red/blue parts denote the area irradiated/non-irradiated by protons and the transition between (yellow–green) is the penumbra region.
    (a) The ESF function for the OD value along the direction of the vertical knife edge. The red dashed line shows the fitting curve of the averaged experiment results (black solid line) with d the penumbra width. Data range at different x-positions is denoted by dev. (b) Proton source size with regards to different energies. Black line denotes linear fitting for experimental results. Blue stars represent the measurement using the mesh method and red pentagrams represent the simulation results at t = 600 fs. Horizontal error bars are determined by the RCF uncertainty and different stack combinations. The longitudinal errors result from three shoots.
    Fig. 3. (a) The ESF function for the OD value along the direction of the vertical knife edge. The red dashed line shows the fitting curve of the averaged experiment results (black solid line) with d the penumbra width. Data range at different x-positions is denoted by dev. (b) Proton source size with regards to different energies. Black line denotes linear fitting for experimental results. Blue stars represent the measurement using the mesh method and red pentagrams represent the simulation results at t = 600 fs. Horizontal error bars are determined by the RCF uncertainty and different stack combinations. The longitudinal errors result from three shoots.
    Results from PIC simulations. The magnetic field distribution along the z-direction at the rear side of the target at (a) t = 120 fs and (c) t = 400 fs. The electron density distribution at the rear side at (b) t = 120 fs and (d) t = 400 fs. (e) The normalized transverse momentum of protons at t = 140 fs. (f) The proton density normalized to nc at t = 400 fs. The solid lines represent the boundary of the main target whereas the dashed lines represent the critical-density location in pre-plasma.
    Fig. 4. Results from PIC simulations. The magnetic field distribution along the z-direction at the rear side of the target at (a) t = 120 fs and (c) t = 400 fs. The electron density distribution at the rear side at (b) t = 120 fs and (d) t = 400 fs. (e) The normalized transverse momentum of protons at t = 140 fs. (f) The proton density normalized to nc at t = 400 fs. The solid lines represent the boundary of the main target whereas the dashed lines represent the critical-density location in pre-plasma.
    (a) Evolution of the Bz field at the rear target side as a function of time. Here Bcal is calculated from the longitudinal net electron current density Jx and the lilac area represents the filamentation window. (b) The transverse profile of proton density at t = 1.4 ps.
    Fig. 5. (a) Evolution of the Bz field at the rear target side as a function of time. Here Bcal is calculated from the longitudinal net electron current density Jx and the lilac area represents the filamentation window. (b) The transverse profile of proton density at t = 1.4 ps.
    C. Y. Qin, H. Zhang, S. Li, S. H. Zhai, A. X. Li, J. Y. Qian, J. Y. Gui, F. X. Wu, Z. X. Zhang, Y. Xu, X. Y. Liang, Y. X. Leng, B. F. Shen, L. L. Ji, R. X. Li. Mapping non-laminar proton acceleration in laser-driven target normal sheath field[J]. High Power Laser Science and Engineering, 2022, 10(1): 010000e2
    Download Citation