• Acta Photonica Sinica
  • Vol. 50, Issue 2, 115 (2021)
Xiaofeng LI1, Jiaojiao LI1, Jinsha LI1, Yaohong QIAN2, Tianning SU1, and Qiang WANG1
Author Affiliations
  • 1North Night Vision Technology Co.,Ltd, Kunming65027, China
  • 2North Night Vision Science &Technology Research Institute Group Co.,Ltd, Kunming65017, China
  • show less
    DOI: 10.3788/gzxb20215002.0225001 Cite this Article
    Xiaofeng LI, Jiaojiao LI, Jinsha LI, Yaohong QIAN, Tianning SU, Qiang WANG. Measure and Comparison between the Second-generation and the Third-generation Image Intensifier within the Different Region of Wavelength[J]. Acta Photonica Sinica, 2021, 50(2): 115 Copy Citation Text show less
    Spectral response of photocathode between sample 036# and 303#
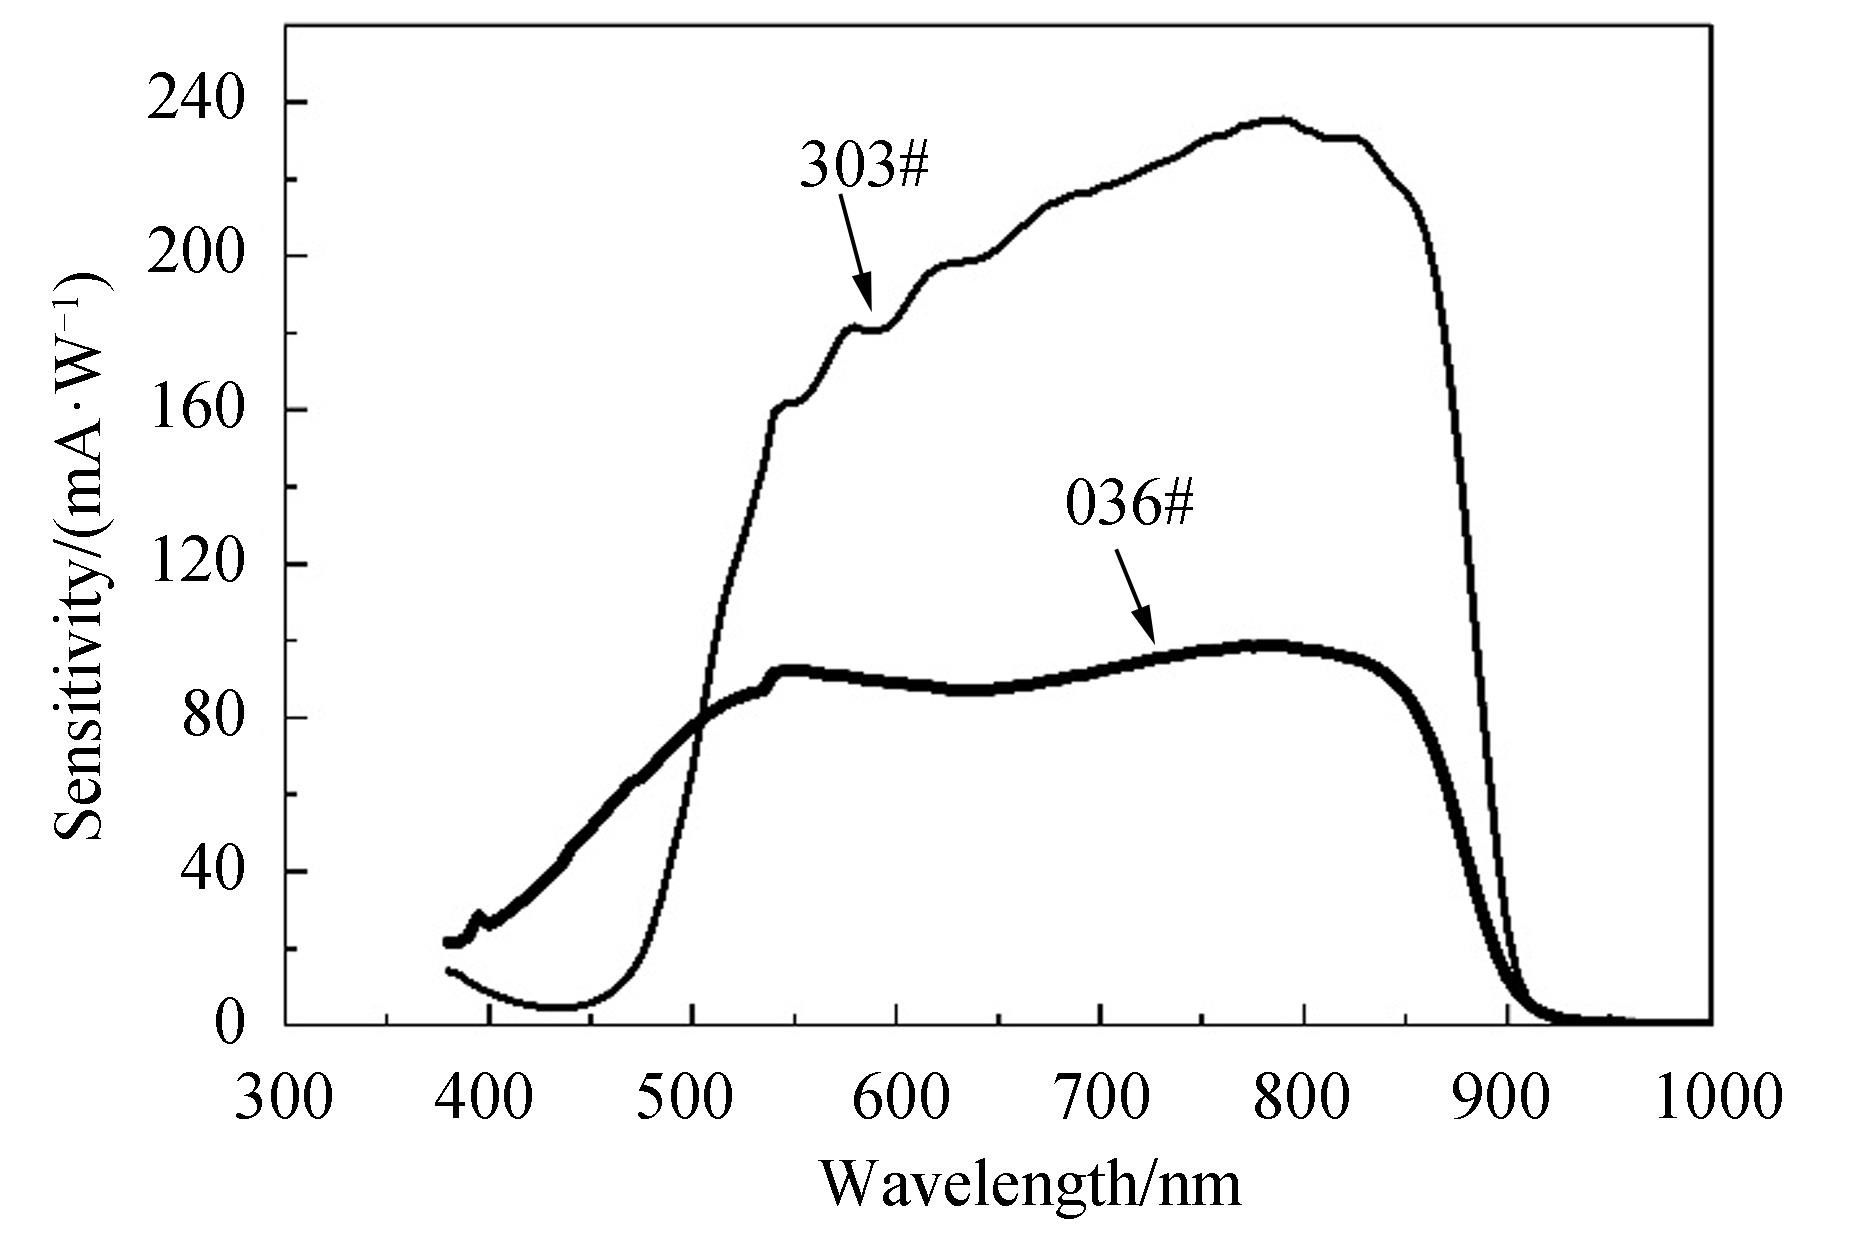
    Fig. 1. Spectral response of photocathode between sample 036# and 303#
    Spectral radiation of tungsten lamp in the color temperature of 2 856 K
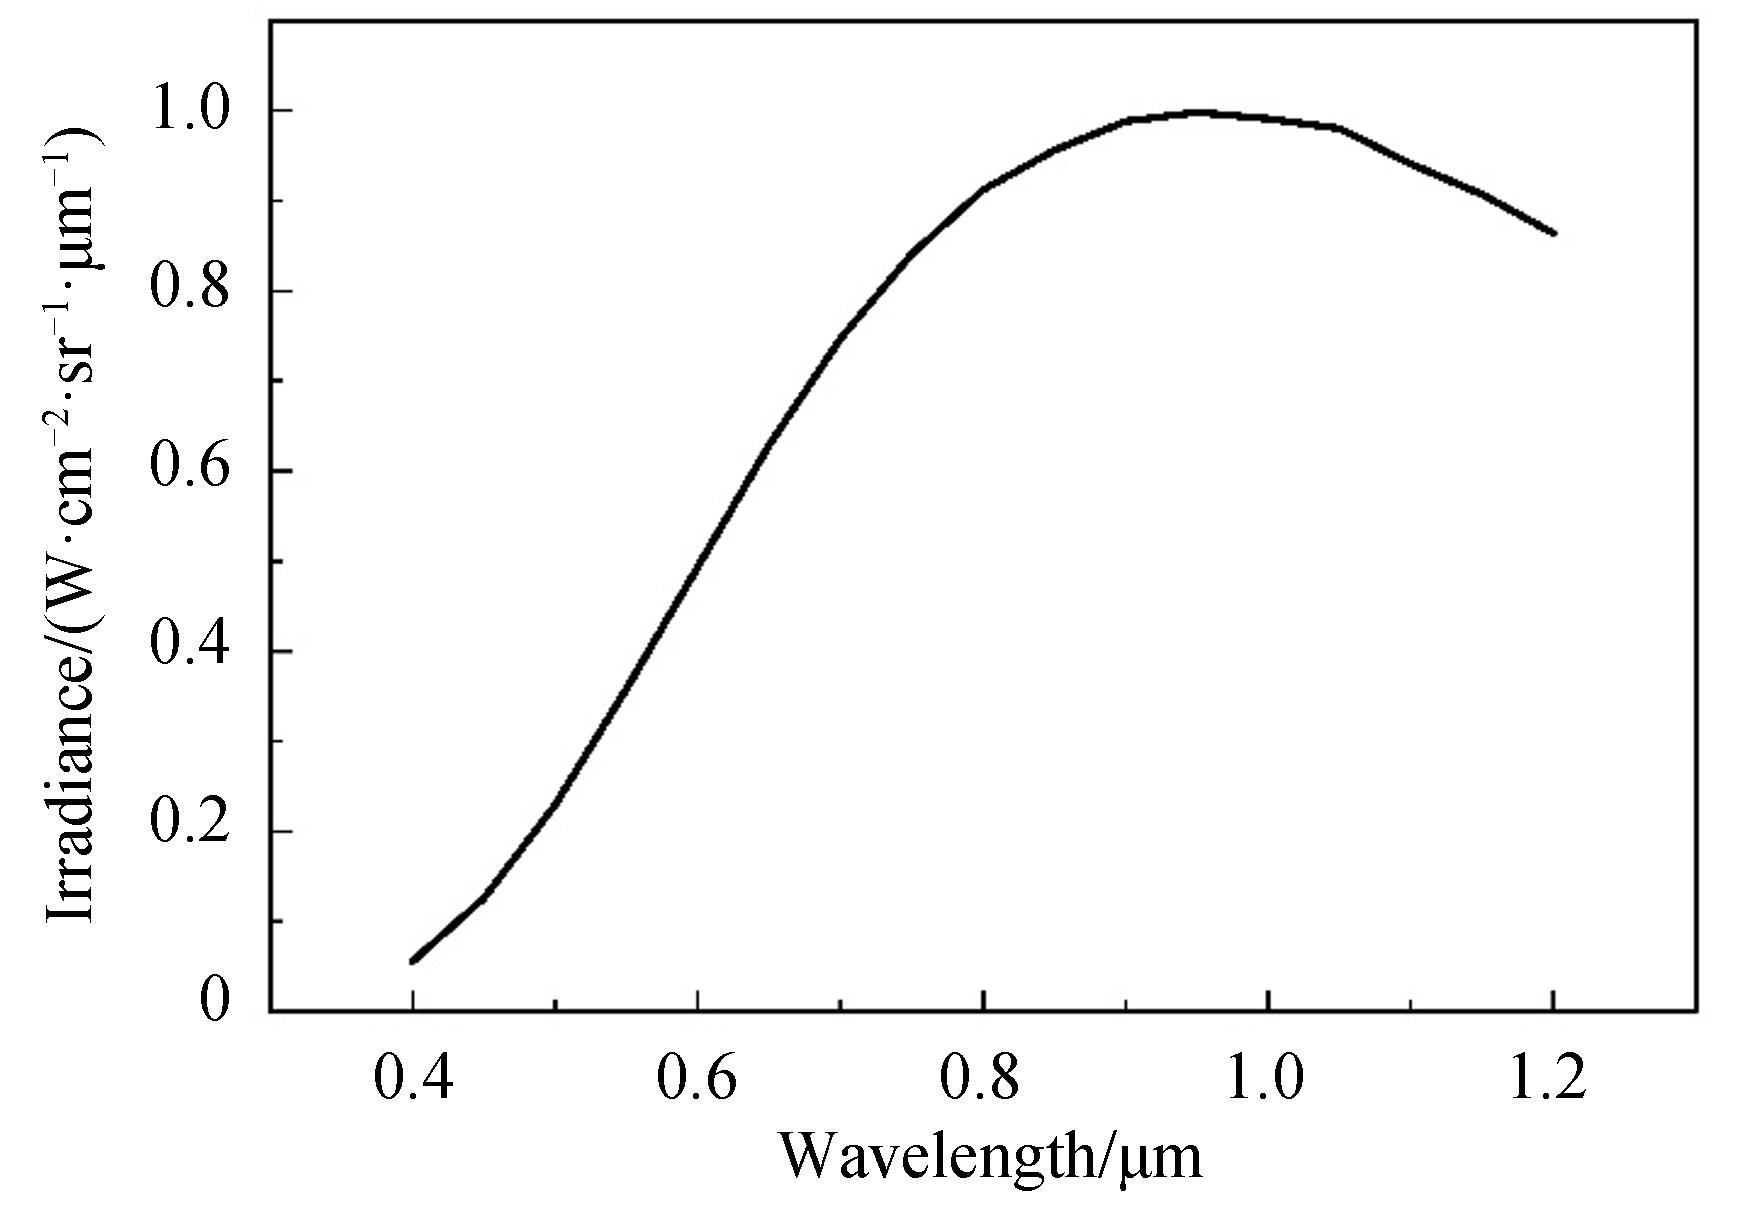
    Fig. 2. Spectral radiation of tungsten lamp in the color temperature of 2 856 K
    Sample

    A luminant

    Sensitivity/(μA·lm-1

    ≥ 550 m/≥ 625 nm/≥ 675 nm/
    Sensitivity/(μA·lm-1Percentage/%Sensitivity/(μA·lm-1Percentage/%Sensitivity/(μA·lm-1Percentage/%
    036#963922967758069172
    303#2 2402 200981 900851 70476
    Table 1. Sensitivity within the different region of wavelength
    SampleA luminant/≥ 550 m/≥ 625 nm/≥ 675 nm/

    Gain/

    (cd·m-2·lx-1

    Gain/

    (cd·m-2·lx-1

    Percentage/%

    Gain/

    (cd·m-2·lx-1

    Percentage/%

    Gain/

    (cd·m-2·lx-1

    Percentage/%
    036#15 00013 5009012 150816 22070
    303#15 00014 400968 880873 45076
    Table 2. Gain within the different region of wavelength
    SampleA luminant≥ 550 m/≥ 625 nm/≥ 675 nm/
    SNRSNRPercentage/%SNRPercentage/%SNRPercentage/%
    036#30.428.99526.38723.577
    303#31.331.09926.88625.782
    Table 3. Signal to noise ratio within the different region of wavelength
    SampleA luminant≥ 550 m/≥ 625 nm/≥ 675 nm/
    SNRSNRPercentage/%SNRPercentage/%SNRPercentage/%
    036#10.910.2949.1838.477
    303#11.211.0989.6869.282
    Table 4. Signal to noise ratio within the different region of wavelength in low illumination
    SampleA luminant/≥ 550 m/≥ 625 nm/≥ 675 nm/
    Resolution/(lp·mm-1Resolution/(lp·mm-1Percentage/%Resolution/(lp·mm-1Percentage/%Resolution/(lp·mm-1Percentage/%
    036#646410060946094
    303#54541005410054100
    Table 5. Resolution within the different region of wavelength in high illumination
    SampleA luminant/≥ 550 m/≥ 625 nm/≥ 675 nm/

    Resolution/

    (lp·mm-1

    Resolution/(lp·mm-1Percentage/%Resolution/(lp·mm-1Percentage/%Resolution/(lp·mm-1Percentage/%
    036#14.314.310013.59412.185
    303#2020100201001890
    Table 6. Resolution within the different region of wavelength in low illumination
    SampleA luminant/%≥550 nm/%≥625 nm/%≥675 nm/%
    036#22222318
    303#37373733
    Table 7. Percentage decrease of resolution in low illumination
    Xiaofeng LI, Jiaojiao LI, Jinsha LI, Yaohong QIAN, Tianning SU, Qiang WANG. Measure and Comparison between the Second-generation and the Third-generation Image Intensifier within the Different Region of Wavelength[J]. Acta Photonica Sinica, 2021, 50(2): 115
    Download Citation