 AI Video Guide
  AI Picture Guide
 AI One Sentence

Linjun Zhai, Yongzhao Du, Xunxun Wu, Yong Diao, Yuqing Fu, "Laser speckle contrast imaging based on uniting spatiotemporal Fourier transform," Chin. Opt. Lett. 22, 011701 (2024)
- Chinese Optics Letters
- Vol. 22, Issue 1, 011701 (2024)
Note: This section is automatically generated by AI . The website and platform operators shall not be liable for any commercial or legal consequences arising from your use of AI generated content on this website. Please be aware of this.
Abstract
Keywords
1. Introduction
Laser speckle contrast imaging (LSCI) is an in vivo optical imaging technique based on the dynamic light scattering of coherent light illumination, which can dynamically monitor blood perfusion distribution in the microcirculatory system[1]. Due to the advantages of simplicity, noninvasiveness, high spatiotemporal resolution, and full-field imaging[2,3], LSCI is widely used to assist disease diagnosis and treatments by monitoring blood flow changes in retinal[4], skin[5], brain[6], hepato-renal intestinal microcirculation[7], and surgical situations[8], which makes it of significant value in biomedical research and clinical applications[9].
The statistical analysis of the raw speckle images is the key to mapping the blood flow image in LSCI, and numerous studies have aimed to improve the calculation of contrast to improve the imaging quality and performance[10,11]. In conventional LSCI techniques, the laser speckle spatial contrast analysis (LSSCA)[12], laser speckle temporal contrast analysis (LSTCA)[13], and spatiotemporal laser speckle contrast analysis (stLASCA)[14] all fall into the domain of filtration procedures that use the rectangular window to calculate the contrast that cannot achieve high-quality imaging, high statistical accuracy, and fast imaging. Recently, the Fourier-based Gaussian sliding window[15] and the adaptive window[16] were introduced into the calculation of LSCI, which has made a great breakthrough in developing LSCI technology. On the other hand, statistical accuracy, imaging quality, and reconstruction speed are closely related to the frame number of the raw speckle images[17–19]. The limitations of spatiotemporal statistical window size can reduce the computation but increase the noise and introduce system deviation[20]. However, a larger number of frames will increase the reconstruction time of the blood flow image. Scholars have conducted many studies on computational and statistical methods to find the optimal balance between image quality, frame number, and computational performance[17,20,21]. Skipetrov et al. derived the fluctuation model between the local spatial speckle contrast square and the frame number. Furthermore, they analyzed the fluctuation of the spatial speckle contrast with the sample size in different speckle sizes[20]. Hong et al. investigated the effect of different sampling frames on the accuracy of the temporal speckle contrast and revealed a quantitative relationship between the sample size and the contrast value[17]. Considering the effect of red blood cell static components from movement direction on contrast, Rege et al. proposed an anisotropic LSCI (aLSCI)[21]. The method uses only three consecutive speckle images for contrast calculation, which improves the temporal resolution by reducing the frame number; meanwhile, the local contrast is calculated along the axial direction of the vessel, which allows the calculation of vessels with single-pixel resolution and improves spatial resolution by reducing the size of the local spatial window.
As can be seen, obtaining high-imaging-quality blood flow distribution maps requires sacrificing real-time performance. This is reflected in Refs. [22–26]. Yaguang Zeng’s team reconstructed blood flow images based on the modulation depth (MD) defined by the dynamic and static speckle components extracted by applying the time-frequency transformation and filtering to the time-varying signals[22]. This method has great potential in microangiography, as it is insensitive to blood flow velocity[22–25]. Besides, due to the frequency-domain analysis performed on the time sequences of the signals of each pixel, it can produce high-resolution images. However, it will also lead to large imaging noise. Thus, we need to increase the frames to suppress the noise and measurement error. The increase in frames and the implementation of single-point scanning both contribute to the rise in the computing load, which can result in insufficient real-time performance. To address this problem, Wang et al.[26] proposed a real-time full-field optical angiography method using principal component analysis (PCA), which can reconstruct contrast images with a high signal-to-noise ratio (SNR) using fewer raw images.
Sign up for Chinese Optics Letters TOC. Get the latest issue of Chinese Optics Letters delivered right to you!Sign up now
Inspired by the above research, the LSCI based on uniting spatiotemporal Fourier transform (LSCI-uSTFT) is proposed to achieve high-quality and fast imaging. This method utilizes the three-dimensional (3D) Fourier transform to simultaneously perform the Fourier transform on the temporal and spatial domain signals of the raw speckle image sequence. Subsequently, filtering is applied in the spatiotemporal frequency domain to separate dynamic and static speckle components. The LSCI-uSTFT method significantly reduces computational complexity and takes advantage of spatiotemporal analysis. Therefore, it can improve the contrast-to-noise ratio (CNR) and imaging contrast while addressing the long reconstruction time caused by a large number of frames, resulting in enhanced imaging quality and computational efficiency.
2. Materials and Methods
The details of LSCI-uSTFT are described as follows. First, the raw speckle image sequence (3D speckle image stack) is transformed to a 3D spatiotemporal frequency domain by a 3D fast Fourier transform. Second, 3D high-pass and low-pass Gaussian filters are applied to separate the high- and low-frequency components in the spatiotemporal frequency domain. Then, we apply the inverse 3D Fourier transform to both low- and high-frequency components to obtain the dynamic and static speckle components. Third, we average both components on the time sequences at each independent pixel. Finally, we calculate the time-averaged MD to map the two-dimensional (2D) blood flow distribution.
From the mathematical viewpoint, the LSCI method that uses a rectangular window for local filtering averages is not the best way to obtain high-quality imaging. A Fourier-based Gaussian window for local filtering averages on the raw speckle data can help to calculate the contrast consistently for each coordinate of the 3D data, resulting in a highly robust laser speckle contrast image. Thus, this paper uses 3D Fourier-based Gaussian filters to separate dynamic and static speckle components. We increase the spatial dimension in the fast Fourier transform (FFT) and use 3D-FFT to convert the 3D spatiotemporal speckle data into the frequency domain and then perform Gaussian filtering. On the one hand, using a Gaussian filter instead of box filtering has several advantages. First, the Gaussian function is unimodal, meaning it will not overly distort the image. Second, the Fourier transform spectrum of the Gaussian function has a single lobe, making it easier to separate high-frequency and low-frequency signals in the speckle signal. This is particularly useful in obtaining high-quality blood flow contrast images during follow-up processing. Third, the Gaussian function can be separated, which means that the computation amount increases linearly with the width of the filter template instead of exponentially, thus reducing the computational complexity. On the other hand, unlike the 1D-FFT used in LSCI based on intensity fluctuation modulation (LSCI-IFM) and 2D-FFT used in Ref. [15], the 3D-FFT used in LSCI-uSTFT can reduce the computation complexity. Moreover, since the FFT is linear, the combination of spatial and temporal Fourier transform prolongs the exposure time of the speckle images in a computational sense while avoiding the issues of overexposure, saturation, and reduced contrast that may arise from physical overexposure. Therefore, utilizing the LSCI-uSTFT in processing spatiotemporal signals of raw speckle images holds great potential for improving computational efficiency and optimizing the overall imaging performance.
According to the principle of LSCI, the speckle signal generated by coherent light irradiation on biological tissue consists of a dynamic component from moving red blood cells and a static component from the background[24]. The static speckle component does not change with time, while the dynamic speckle component varies over time. On a very long exposure speckle image, due to the temporal variation of the dynamic speckle and the time-invariance of the static speckle, the dynamic speckle is smoothed, while the static speckle retains relatively high values. Therefore, in this paper, the dynamic speckle component can be obtained by low-pass filtering, while the static speckle component can be obtained by high-pass filtering,
The MD[26] definition
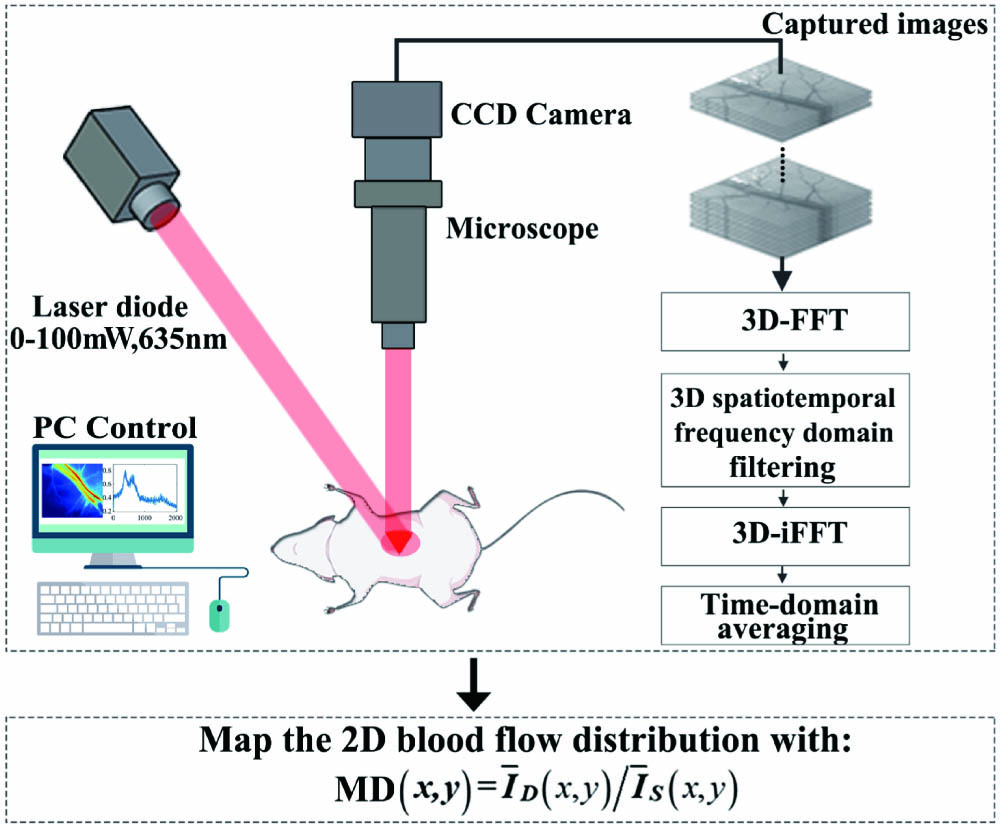
To illustrate the LSCI-uSTFT method, we set up the LSCI experimental system shown in Fig. 1 and conducted the following phantom and animal verification experiments. First, in the phantom experiment, we filled a capillary glass tube with an inner diameter of 0.8 mm and an outer diameter of 1.4 mm with 1% emulsion. The liquid flow was controlled using a syringe pump and injected into the tubing at a constant rate of 0.42 mL/s. A low-power semiconductor laser ranging from 0 to 100 mW with a central wavelength of 635 nm was used as the illuminating light source to ensure no damage to biological tissue. The laser beam uniformly irradiates the glass capillary tube at a 60-deg angle of incidence. Then, we used a CCD camera (Balser acA-2440-75uc) connected to a microscope imaging lens (
![]()
Figure 1.Schematic and experimental diagram. Laser (semiconductor laser, wavelength 635 nm, output power 0–100 mW); CCD (Balser acA-2440-75uc, resolution 2448 pixels × 2048 pixels); microscope (0.7× to 4.5×).
Subsequently, approved by the Ethics Committee for the Management of Laboratory Animals, School of Medicine, Huaqiao University, we performed hemoperfusion imaging of the mesentery on ahealthy male mice (approximately 25 g). We anesthetized the mouse with approximately 50 mg/kg of chloral hydrate and positioned it supine on the experimental table. Then, we made a 3-cm-long incision in the abdominal region of the mouse using a scalpel to expose the intra-abdominal region and selected the mesenteric vessel area for blood flow imaging.
To further explain the advantages of the proposed method, we chose stLASCA and LSCI-IFM methods as references for comparison. On the one hand, stLASCA theoretically has the best imaging quality among conventional LSCI methods[18]. Thus, by comparing with stLASCA, we can verify whether the proposed method is superior to the conventional LSCI method in terms of image quality. On the other hand, LSCI-IFM only performs Fourier transform filtering on the speckle image sequence from the time-domain perspective to separate dynamic and static speckle components. By comparing with LSCI-IFM, we can verify whether the LSCI-uSTFT method, which performs FFT in both time and spatial domains, is superior in imaging quality and computational efficiency. Furthermore, a limited spatiotemporal statistical window can reduce the computation but lead to much image noise and introduce systematic bias instead. On the contrary, a larger spatiotemporal statistical window will lose the details, increase the reconstructed time of the blood flow images, and reduce the temporal resolution[17,18]. In addition, considering that the raw speckle images generally used in practical applications usually range from 128 to 256 frames, the time and the space windows are set to 256 frames and
3. Results
Figure 2 shows the blood flow contrast images of LSCI-IFM, stLASCA, and LSCI-uSTFT in the phantom experiments. We can note that compared with LSCI-IFM, the blood flow distribution images processed by LSCI-uSTFT have less noise, and the range between the blood flow signal and the background signal is larger. Imaging contrast measures the distinguishability between the blood flow signal and the background signal[27]. Thus, the method proposed in this study has a higher imaging contrast than LSCI-IFM. However, it is important to note that we cannot draw a definitive conclusion regarding the superiority of LSCI-uSTFT over stLASCA based solely on the phantom experiment because Fig. 2 shows that the denoising ability and imaging contrast of the LSCI-uSTFT are comparable to those of stLASCA.
![]()
Figure 2.Comparative results of the phantom experiments. (a)–(c) LSCI-IFM, stLASCA, and LSCI-uSTFT images. (A)–(C) Curves of the MD (LSCI-IFM), K (stLASCA), MD (LSCI-uSTFT) along the dashed line in (a)–(c).
Therefore, we conducted verification on mice further to compare the imaging performance of stLASCA and LSCI-uSTFT. Figure 3 shows that the background signal has higher values and is not well distinguished from the blood flow signal in stLASCA. Besides, the blood flow images tend to saturate, indicating that the standard deviation of the blood flow images mapped by stLASCA is small, and the measurable signal range of stLASCA is limited. As a result, stLASCA may not be able to quantitatively measure the blood flow information in large blood vessels with fast blood flow velocities, whose variance is smaller than the camera noise/lens noise variance. This limitation is due to the utilization of local windows for spatial averaging in stLASCA, which enhances the background signal and leads to a higher value approximating the blood flow signal. The method that uses a Fourier-based Gaussian sliding window to calculate the contrast can partially solve the above problem[15]. However, this method can make the processed image look blurry and distorted because it can efficiently smooth the noise. This makes the outline of blood vessels more distinct, which is beneficial for the contour extraction of large blood vessels, but it will also lose too much detail and reduce the calculation accuracy. As a tool for assisting clinical diagnosis and basic research in life science, LSCI mainly focuses on measuring hemodynamic parameters. The distortion and loss of blood flow information will undoubtedly seriously impact diagnosis and measurement.
![]()
Figure 3.Comparative results of the in vivo experiments. (a) Normalized blood flow distribution of stLASCA; (b) LSCI-uSTFT image; (c) curves along the dashed line in (a) and (b).
Based on the above experiments, it is preliminarily proved that the proposed method has advantages in improving image quality. It is mainly reflected in the following aspects. First, compared with LSCI-IFM, the proposed method has a good denoising ability and better distinguishing ability between blood flow signal and background signal, that is, higher imaging contrast. Second, compared with stLASCA, the method proposed in this paper can measure a large range of signals, which has advantages in improving the imaging contrast. Besides, unlike the method based on contrast to map blood flow images, our method is based on MD of intensity fluctuations to reconstruct blood flow images, meaning our method focuses on intensity changes in blood flow. By focusing on intensity changes in blood flow, our method can better capture dynamic features such as blood flow velocity, flow rate, and vascular wall pulsation. This is of great significance for studying hemodynamics and diagnosing certain vascular diseases. Moreover, differing from the method that employs the Fourier transform for implementing sliding filtering to obtain the mean value in the contrast calculation formula[15], our method uses the Fourier transform for frequency-domain transformation to separate dynamic and static speckle components, which allows us to study the characteristics of blood flow and identify any abnormalities or changes that may be indicative of certain diseases or conditions.
Figure 4 shows the quantization results of CNR, which are further used to prove that the proposed method can effectively improve the SNR. As shown in Fig. 4(a), we randomly selected the ROIs to calculate the CNR and spatial noise of different methods[21,28]. CNR is used to evaluate the distinction between blood flow and background signals. Spatial noise is defined as the normalized value of the pixel intensity variation in the local area, which can be used to evaluate the noise level of the image. From the comparison results [Figs. 4(b) and 4(c)], we can note that CNR increases with the increase in frames, while spatial noise decreases with the increase in frames. In our approach, the CNR and the spatial noise, respectively, approach 6 and 0.18 when the frames reach 256, which showed that the CNR and the noise index with the proposed method are comparable to stLASCA. In addition, our approach can obtain higher CNR and lower spatial noise when compared with LSCI-IFM. The analysis results above are consistent with those shown in Fig. 2.
![]()
Figure 4.Comparative results of noise suppression ability with different methods. (a) Contrast image obtained by LSCI-uSTFT, where Area1–Area6 are six ROIs randomly selected; (b) comparison of CNR; (c) comparison of spatial noise.
In general, the three experiments mentioned above have proved the advantages of the proposed method in improving image quality indicators such as image contrast and SNR from subjective quality assessment and objective quantitative analysis. The experimental results indicate that the proposed method is superior to LSCI-IFM in image contrast and SNR. Furthermore, it can measure a larger range of signals while maintaining a high SNR comparable to stLASCA, resulting in a more pronounced image contrast.
Figure 5 analyzes the relationship between sample statistics and contrast. As shown in Fig. 5(a), we randomly selected the ROIs from the vessel and tissue to analyze the relationship between MD and frames in LSCI-uSTFT. Figure 5(b) shows that MD increases significantly within 0 to 64 frames in the vessel and then increases slowly. In the tissue, MD increases significantly within 0 to 48 frames and then reaches saturation at higher frames. Overall, in LSCI-uSTFT, with frames increasing, the blood flow signal is gradually enhanced, while the background signal is also enhanced in a small range but gradually tends to saturation. The experiment proves that the method proposed in this paper can improve the strength of the blood flow signal by increasing the frame number of speckle images without greatly increasing the strength of the background signal. Therefore, a wide range of signals can be measured with better contrast and SNR.
![]()
Figure 5.(a) MD (LSCI-uSTFT) image; (b) relationship between the MD and the reconstructed frame number; (c) MD (LSCI-uSTFT) images of blood flows reconstructed with 16, 32, 64, and 256 frames.
Furthermore, we verified the effect of sample statistics on blood flow contrast images on mice. Figure 5(c) shows the results obtained using LSCI-uSTFT to process 16, 32, 64, and 256 frames of raw speckle images, respectively. It can be seen that, with frames increasing, LSCI-uSTFT can effectively suppress the static tissue signals and enhance the dynamic signals of the vessels. In addition, the signals of vessel 1 and vessel 2 in Fig. 5(c) become clearer, and more details appear in the blood flow images when more raw speckle images are used. This result is consistent with the analysis in Fig. 5(b). In a word, LSCI-uSTFT can improve the imaging quality by increasing the frames, mainly in image contrast enhancement and noise reduction of the blood flow images. LSCI-uSTFT directly performs an overall spatiotemporal frequency domain transformation on the speckle image sequences
Figure 6 compares the computational speed of LSCI-IFM, stLASCA, and LSCI-uSTFT to demonstrate the advantages of LSCI-uSTFT in computational performance. We compared the computational speed of the proposed method with other algorithms in processing the speckle images with pixels of
![]()
Figure 6.Comparative results of the calculation time with LSCI-IFM, stLASCA, and LSCI-uSTFT.
Considering the analysis results from Figs. 5 and 6 comprehensively, we can note that LSCI-uSTFT can improve the imaging quality by increasing the number of frames; meanwhile, it has advantages in computational efficiency so that the proposed method can achieve fast and high-quality imaging.
4. Discussions
In summary, in this paper, we propose the LSCI-uSTFT method to effectively balance imaging quality and computational efficiency for achieving fast and high-quality imaging. The method uses the 3D Fourier transform to simultaneously analyze the acquired temporal and spatial speckle signals in the spatiotemporal frequency domain. Then, it separates the dynamic blood flow signal from the static tissue signal with 3D Gaussian filters. The method has the following advantages. (1) It can significantly improve the SNR of imaging, enhance imaging contrast, and measure a wide range of blood flow signals. (2) By parallel processing spatiotemporal information, our method reduces computational complexity and improves computational efficiency. Specifically, regarding imaging quality, LSCI-uSTFT can provide comparable or slightly lower CNR and spatial noise compared to stLASCA. In addition, it possesses the extra benefit of detecting a more extensive range of blood flow signals, leading to greater imaging contrast. LSCI-uSTFT also outperforms LSCI-IFM by improving imaging contrast and obtaining higher CNR and lower spatial noise, which indicates a better SNR. Regarding computational efficiency, it is evident that LSCI-uSTFT has a faster processing speed than stLASCA and LSCI-IFM. This advantage provides significant value in processing a large number of frames, ultimately obtaining high CNR and contrast blood flow distribution images.
Overall, our method is a promising approach to improving imaging quality and computational efficiency. However, our method also has some limitations. We use a large spatiotemporal window
References
[9] M. Wang, J. C. Hong, F. F. Zhou. Application of laser speckle contrast imaging in the research on brain science. Prog. Biochem. Biophys., 48, 922(2021).
[25] F. L. Zhang, M. Y. Wang, D. A. Han et al. In vivo full-field functional optical hemocytometer. J. Biophotonics, 11, e201700039(2018).
[27] J. W. Goodman. Speckle Phenomena in Optics: Theory and Applications(2007).


Set citation alerts for the article
Please enter your email address

© Copyright 2018-2021 | Chinese Laser Press. All Rights Reserved 沪ICP备15018463号-20