• High Power Laser Science and Engineering
  • Vol. 4, Issue 2, 02000e14 (2016)
Martin W¨olz1, Agnieszka Pietrzak2, Alex Kindsvater1, Jens Meusel1, Klaus Stolberg1, Ralf H¨ulsewede2, J¨urgen Sebastian2, and Valentin Loyo-Maldonado1
Author Affiliations
  • 1Jenoptik Laser GmbH, G¨oschwitzer Str. 29, Jena, Germany
  • 2Jenoptik Diode Lab GmbH, Max-Planck-Str. 2, Berlin, Germany
  • show less
    DOI: 10.1017/hpl.2016.13 Cite this Article Set citation alerts
    Martin W¨olz, Agnieszka Pietrzak, Alex Kindsvater, Jens Meusel, Klaus Stolberg, Ralf H¨ulsewede, J¨urgen Sebastian, Valentin Loyo-Maldonado. Laser diode stacks: pulsed light power for nuclear fusion[J]. High Power Laser Science and Engineering, 2016, 4(2): 02000e14 Copy Citation Text show less
    Pump diode pulse energy levels of HEC-DPSSL installations, sorted by pump wavelength. Solid symbols: systems proven or under construction. Empty symbols: systems at design level.
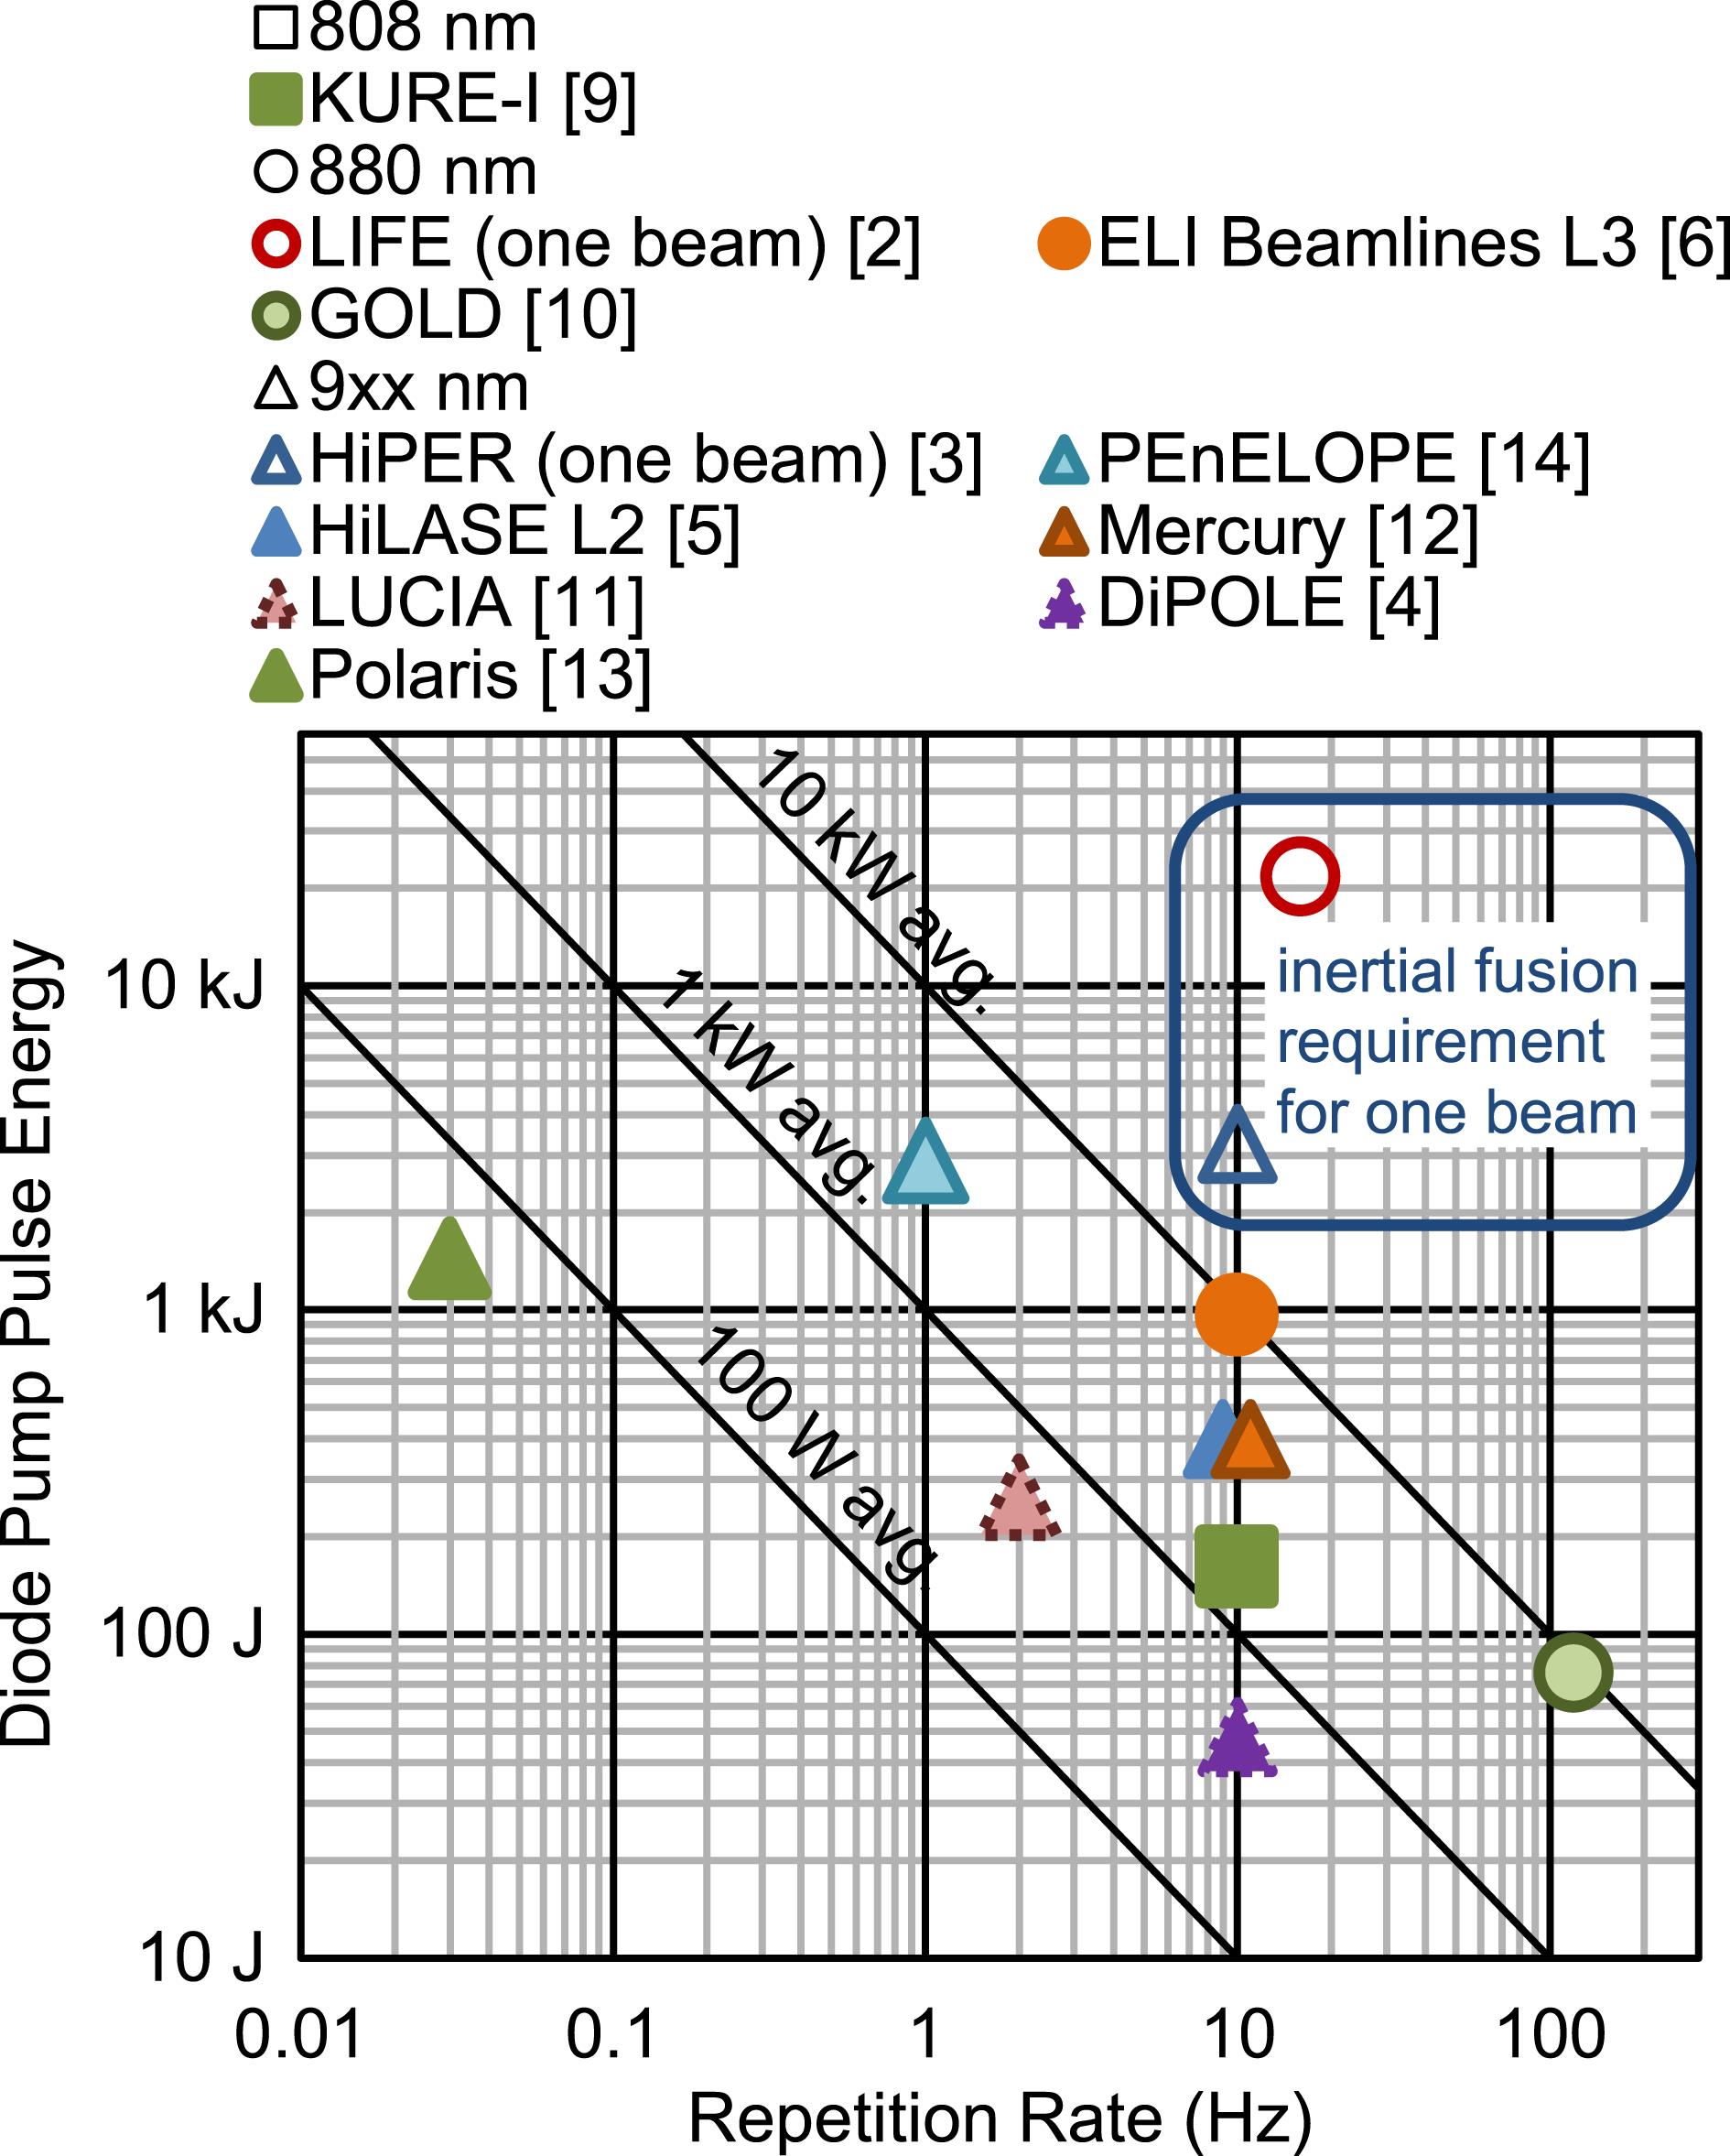
    Fig. 1. Pump diode pulse energy levels of HEC-DPSSL installations, sorted by pump wavelength. Solid symbols: systems proven or under construction. Empty symbols: systems at design level.
    Illustration of Jenoptik’s 940 nm laser diode bar portfolio. For a given technology, the output power is linear with chip size. The New Generation (NG) QCW bars increase output power from 300 to 500 W at the fixed resonator length of 1.5 mm.
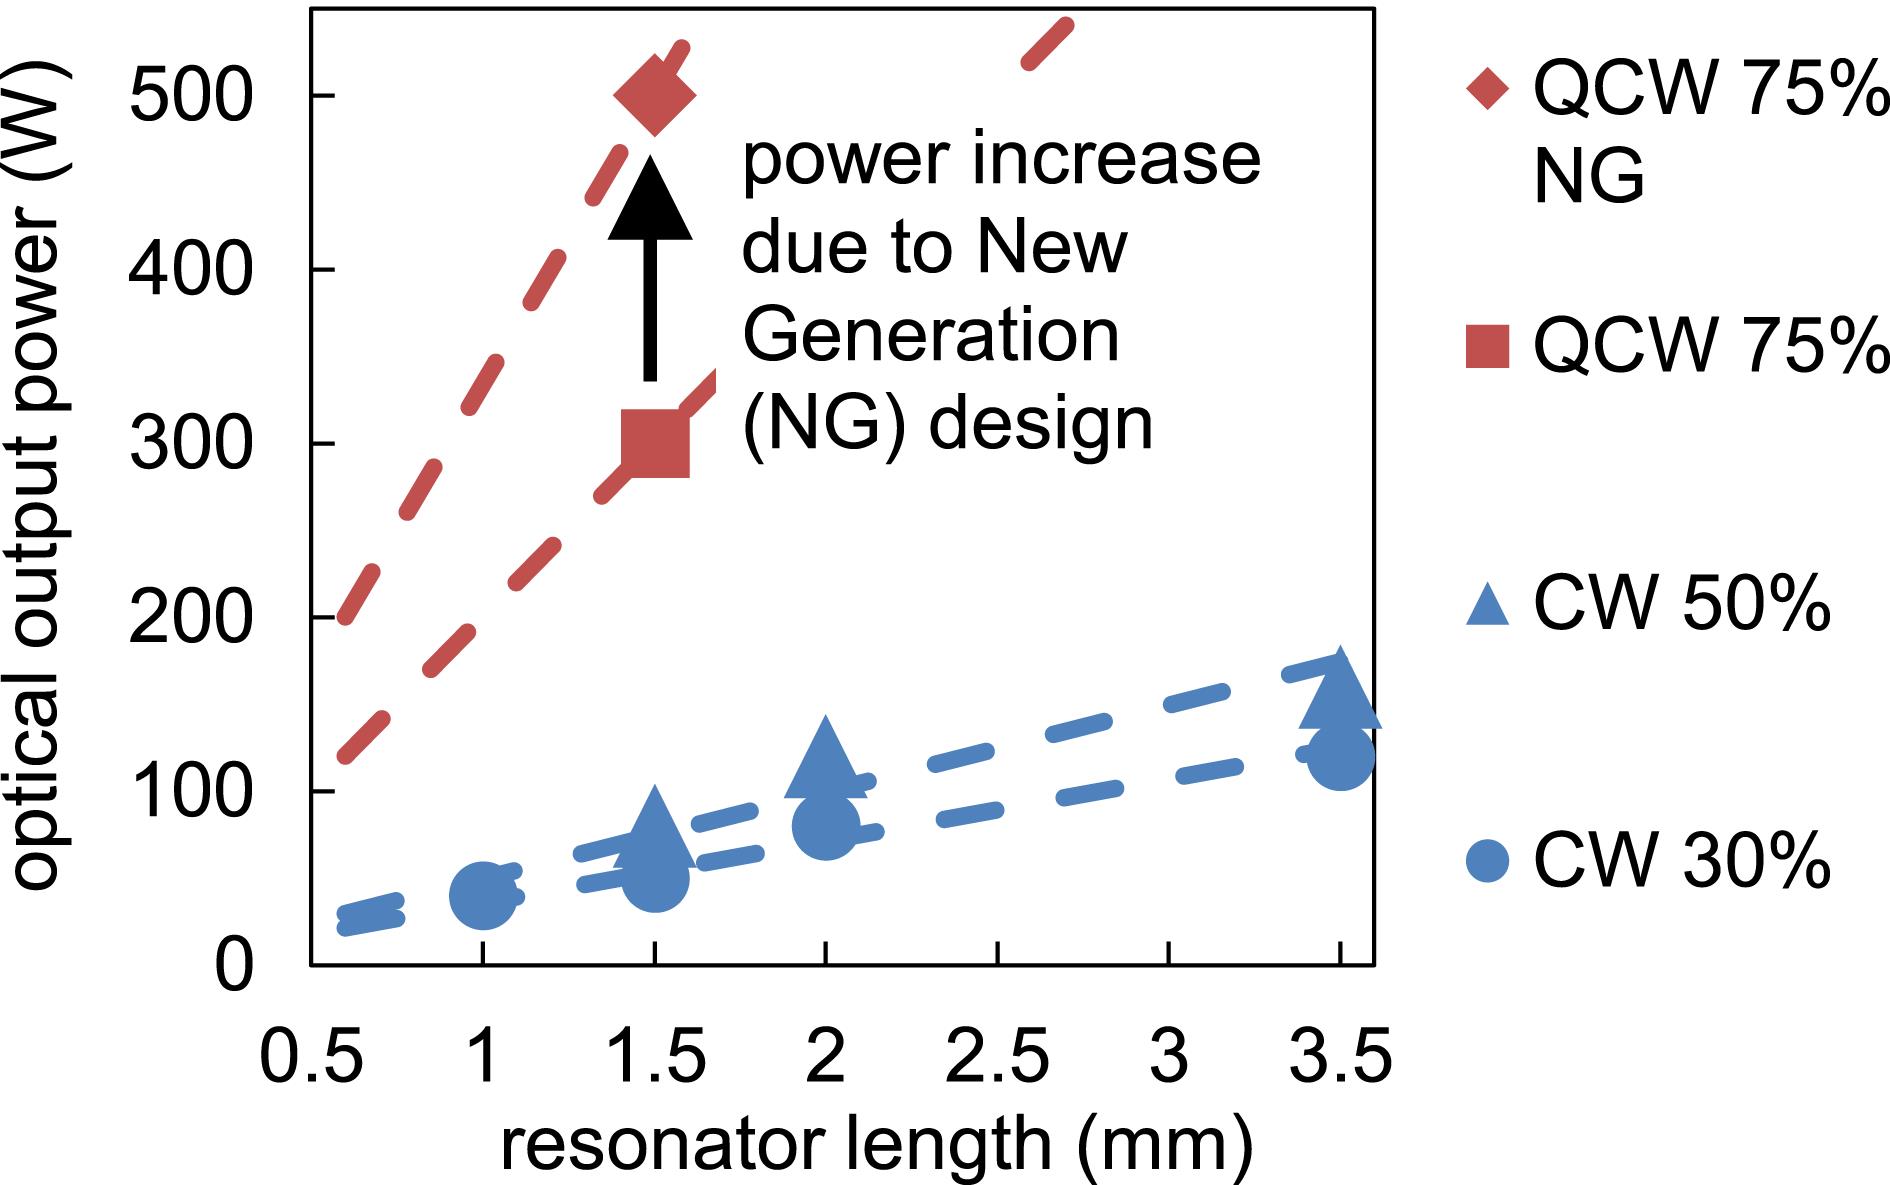
    Fig. 2. Illustration of Jenoptik’s 940 nm laser diode bar portfolio. For a given technology, the output power is linear with chip size. The New Generation (NG) QCW bars increase output power from 300 to 500 W at the fixed resonator length of 1.5 mm.
    808 nm QCW laser diode: output power-versus-current characteristic and efficiency.
    Fig. 3. 808 nm QCW laser diode: output power-versus-current characteristic and efficiency.
    Life testing of 808 nm 500 W QCW bar in constant current mode. The bars are mounted on microchannel heatsinks with $T_{c}=25\,^{\circ }\text{C}$, ${\it\tau}=300~{\rm\mu}\text{s}$, $f=100$ Hz.
    Fig. 4. Life testing of 808 nm 500 W QCW bar in constant current mode. The bars are mounted on microchannel heatsinks with $T_{c}=25\,^{\circ }\text{C}$, ${\it\tau}=300~{\rm\mu}\text{s}$, $f=100$ Hz.
    880 nm QCW laser diode: light output power-versus-current characteristic and wall-plug efficiency.
    Fig. 5. 880 nm QCW laser diode: light output power-versus-current characteristic and wall-plug efficiency.
    Reliability testing of the 880 nm QCW laser diode in constant current mode, mounted on microchannel heatsinks. $T_{c}=25\,^{\circ }\text{C}$, ${\it\tau}=300~{\rm\mu}\text{s}$, $f=100~\text{Hz}$.
    Fig. 6. Reliability testing of the 880 nm QCW laser diode in constant current mode, mounted on microchannel heatsinks. $T_{c}=25\,^{\circ }\text{C}$, ${\it\tau}=300~{\rm\mu}\text{s}$, $f=100~\text{Hz}$.
    Power–voltage–current characteristics of 940 nm laser bars with 75% filling factor and 1.5 mm resonator length. ${\it\tau}=1~\text{ms}$, $f=60~\text{Hz}$, 6% duty cycle, $T_{c}=25\,^{\circ }\text{C}$.
    Fig. 7. Power–voltage–current characteristics of 940 nm laser bars with 75% filling factor and 1.5 mm resonator length. ${\it\tau}=1~\text{ms}$, $f=60~\text{Hz}$, 6% duty cycle, $T_{c}=25\,^{\circ }\text{C}$.
    Comparison of epitaxial structures for kW-class laser bars. The NG structure used in the 500 W bars is compared to structure C. ${\it\tau}=1~\text{ms}$, $f=10~\text{Hz}$, $T_{c}=25\,^{\circ }\text{C}$.
    Fig. 8. Comparison of epitaxial structures for kW-class laser bars. The NG structure used in the 500 W bars is compared to structure C. ${\it\tau}=1~\text{ms}$, $f=10~\text{Hz}$, $T_{c}=25\,^{\circ }\text{C}$.
    Wall-plug efficiency of 940 nm laser bars based on the NG epitaxial structure optimized structure C.
    Fig. 9. Wall-plug efficiency of 940 nm laser bars based on the NG epitaxial structure optimized structure C.
    Photograph of JenLas®QCW Cool laser diode stack with 8 laser bars spaced at 1.7 mm pitch.
    Fig. 10. Photograph of JenLas®QCW Cool laser diode stack with 8 laser bars spaced at 1.7 mm pitch.
    Cross-section of actively cooled QCW stack on mount with illustration of the water passage.
    Fig. 11. Cross-section of actively cooled QCW stack on mount with illustration of the water passage.
    Transient thermal behaviour of the passively cooled QCW stack, showing the thermal impedance $Z_{\mathit{th}}(t)$ of one laser bar. The CW operating temperature is attained after 3 s.
    Fig. 12. Transient thermal behaviour of the passively cooled QCW stack, showing the thermal impedance $Z_{\mathit{th}}(t)$ of one laser bar. The CW operating temperature is attained after 3 s.
    Temperature gradient in pulsed operation of the QCW stack with power dissipation of 1 W per bar during ${\it\tau}=300~{\rm\mu}\text{s}$. The solid lines denote the exact temporal evolution. The dashed lines show the product of $R_{\mathit{th}}$ and the duty cycle.
    Fig. 13. Temperature gradient in pulsed operation of the QCW stack with power dissipation of 1 W per bar during ${\it\tau}=300~{\rm\mu}\text{s}$. The solid lines denote the exact temporal evolution. The dashed lines show the product of $R_{\mathit{th}}$ and the duty cycle.
    Pump power densities achieved with commercially available laser diodes. Squares: JENOPTIK, circles: NGCEO ARR179P6000HDS and Quantel QD-Q5912-B.
    Fig. 14. Pump power densities achieved with commercially available laser diodes. Squares: JENOPTIK, circles: NGCEO ARR179P6000HDS and Quantel QD-Q5912-B.
    Electro-optical data of a passively cooled QCW stack with eight laser bars emitting at 880 nm, ${\it\tau}=300~{\rm\mu}\text{s}$, bar-to-bar pitch 1.7 mm, duty cycle (d.c.) varied between 1% and 10%. (The step in efficiency at 450 A is a measurement artefact.)
    Fig. 15. Electro-optical data of a passively cooled QCW stack with eight laser bars emitting at 880 nm, ${\it\tau}=300~{\rm\mu}\text{s}$, bar-to-bar pitch 1.7 mm, duty cycle (d.c.) varied between 1% and 10%. (The step in efficiency at 450 A is a measurement artefact.)
    Worldwide production capacities for GaAs LEDs and laser bars. InGaAlP (red) LED production capacity from Ref. [22]. LIFE and HiPER one-time demands from Table 1, assuming 220 bars per $4^{\prime \prime }$ wafer.
    Fig. 16. Worldwide production capacities for GaAs LEDs and laser bars. InGaAlP (red) LED production capacity from Ref. [22]. LIFE and HiPER one-time demands from Table 1, assuming 220 bars per $4^{\prime \prime }$ wafer.
    Functionalities of a diode laser pump.
    Fig. 17. Functionalities of a diode laser pump.
    Utilization aspects of standardization at different levels.
    Fig. 18. Utilization aspects of standardization at different levels.
    Laser parameter LIFE HiPER Commercial
    requirement[2]requirement[3] in 2015
    Frequency (Hz) 16 10
    Amplifier Nd:glass Yb:YAG
    No. of beams 384 480
    Pulse energy per beam (kJ) 8.1 1.3
    Pump wavelength (nm) 872 941
    Pump pulse energy
    $\quad$ per beam (kJ)21.63.3
    Pump pulse duration (${\rm\mu}\text{s}$)164700
    Pump power per beam (MW) 132 4.6
    Diode efficiency (%) 64 55
    Array irradiance ($\text{kW}/\text{cm}^{2}$)206see Figure 14
    No. of required 500 W
    $\quad$ bars (Mpc)1014.518 annually
    Packaged diode price ($$/$W)0.011
    Table 1. Inertial fusion laser requirements on pump diodes.
    Laser diode parameterNd-based systemsYb-based systems
    Wavelength (nm)808 880 940
    Peak power (W)500 500 500
    Bar width (mm) 10 10 10
    Resonator length (mm)1.5 1.5 1.5
    Fast axis divergence$^{\text{a}}$ (deg.)654846
    Slow axis divergence$^{\text{a}}$ (deg.)111111
    Operating current (A)450 450 485
    Operating voltage (V)2.2 2.0 1.85
    Conversion efficiency (%) 52 55 53
    Table 2. Jenoptik QCW laser diode bar specifications. All devices possess 37 emitters with a fill factor of 75%.
    Martin W¨olz, Agnieszka Pietrzak, Alex Kindsvater, Jens Meusel, Klaus Stolberg, Ralf H¨ulsewede, J¨urgen Sebastian, Valentin Loyo-Maldonado. Laser diode stacks: pulsed light power for nuclear fusion[J]. High Power Laser Science and Engineering, 2016, 4(2): 02000e14
    Download Citation