Qian Zhou, Jinchao Pang, Xinghui Li, Kai Ni, Rui Tian. Concave grating miniature spectrometer with an expanded spectral band by using two entrance slits[J]. Chinese Optics Letters, 2015, 13(11): 110501
Copy Citation Text
A new miniature spectrometer with two entrance slits is proposed to expand the spectral band. The proposed spectrometer is designed such that the two entrance slits share the same concave grating and detector array. The two slits are located at different positions such that the spectral range of the same light source incident on the detector array varies greatly between the two slits. Only one of the two slits is illuminated at a given time; as such, the two spectral ranges are sequentially measured. Theoretical calculation and experimentation are conducted to verify the proposed design.
Portable miniature spectrometers are used in a wide variety of fields, such as environmental sensing, biological research, geologic survey, and water safety[1–7]. These demands have motivated researchers to develop low-cost and compact spectrometers with both a wide spectral range and a high spectral resolution[8–12]. Among different types of miniature spectrometers, the concave grating type has attracted increased attention because of its compact configuration and reasonable cost. A concave grating spectrometer is equipped with a single concave grating that simultaneously performs light dispersion and light focusing that are generally conducted by a diffraction grating and mirrors in conventional spectrometers[13–19].
However, in view of the nature of spatial-spectral coding in spectrometers, expanding the spectral range while ensuring a resolution that can benefit many applications requires that the number of resolution elements is increased, which expands the length of the detector array along the dispersion axis; such adjustments make spectrometers larger and more expensive[6]. A multigrating design has been proposed recently for expanding the spectral band[10,11]. In this method, two or three concave gratings are used to disperse and focus a given spectral range of an entire spectral band to the same detector array. This method enlarges the spectral band and guarantees the spectrometer’s resolution. However, moving parts such as a precise rotary stage must be added to set the positions of the concave gratings, which introduces challenges to the compactness, stability, and fast measurement of miniature spectrometers.
In this Letter, a new concave grating miniature spectrometer that can overcome the abovementioned challenges is proposed. Instead of multiple gratings, a stationary entrance slit is added. By using two stationary slits the spectral band can be effectively expanded without using any auxiliary concave gratings or enlarging the detector. The principle behind expanding the spectral band is explained in detail as well as the procedure of system design and construction.
Sign up for Chinese Optics Letters TOC. Get the latest issue of Chinese Optics Letters delivered right to you!Sign up now
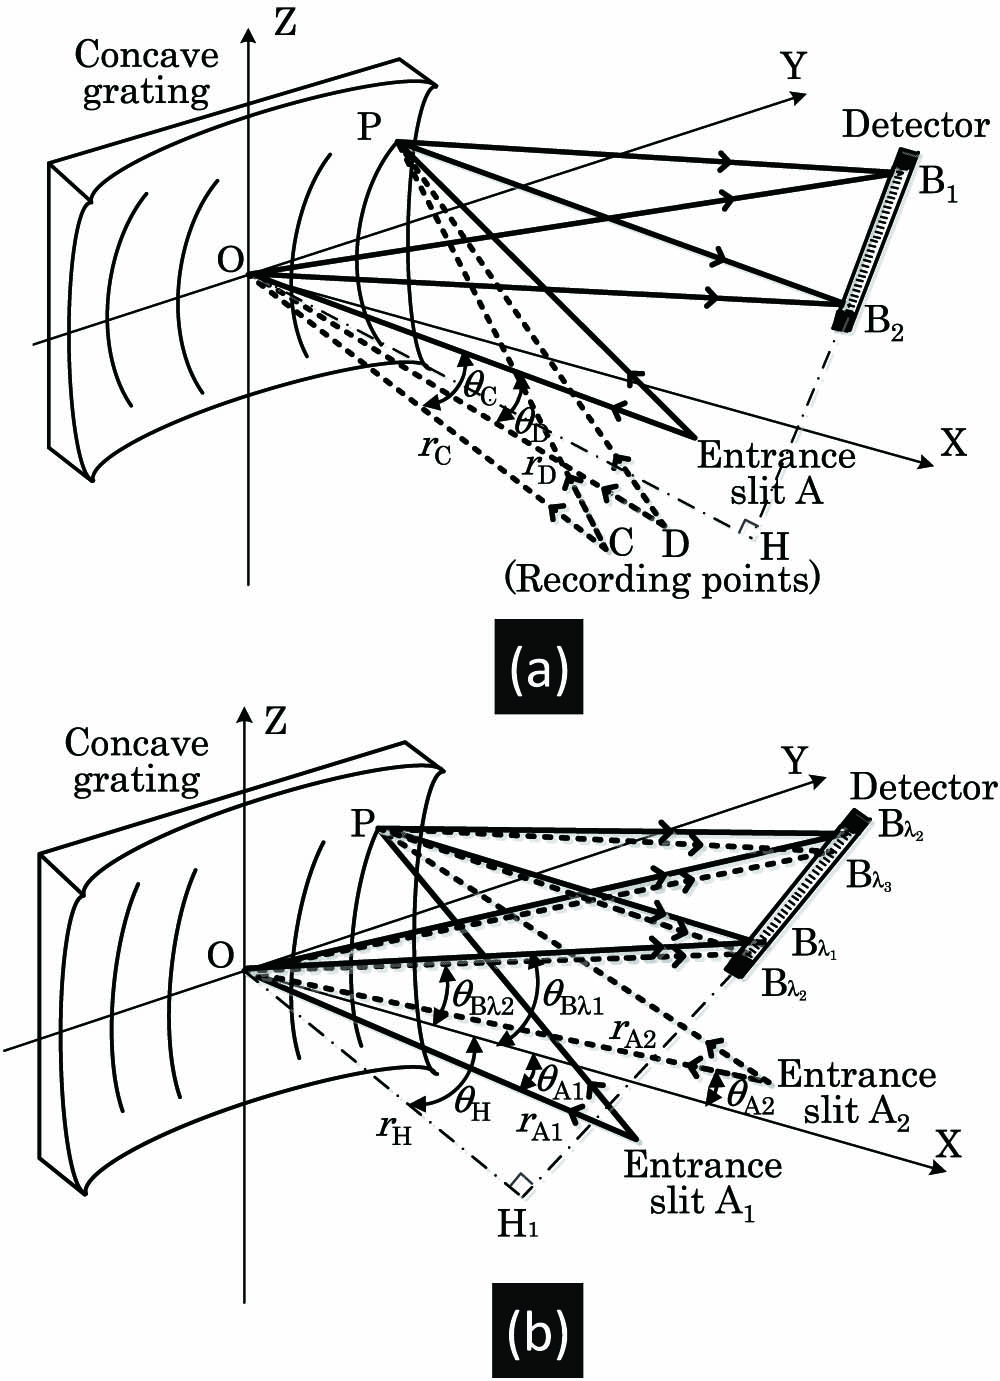
Figure 1 shows the principle behind concave grating spectrometers. In a conventional setup shown in Fig. 1(a), the light for spectrometric analysis raying from entrance slit is projected onto the concave grating where the light is dispersed, focused, and directed to a linear detector array. The axis is coincident with the grating normal. The plane is a plane of symmetry called the dispersion plane. Origin is at the grating center on the Cartesian coordinate system. Points and represent two point sources for forming the grating structures. is the entrance slit. , , and are all located in the meridional plane . is an arbitrary point in the grating. Spectral information of the light is obtained by analyzing the intensity distribution on the detector array. The geometric theory of aberration is utilized to determine the available spectral band and resolution on the basis of the image quality on the detector array by appropriately setting the positions of the entrance slit, the concave grating, and the detector array[20]. However, in a conventional one-entrance slit design, once the spectrometer’s resolution reaches the detector’s limitation, the number of resolution elements must be increased when a wider spectral band is desired. Increasing the number of resolution elements would inevitably enlarge the size of the detector array, thereby increasing the size of the spectrometer and reducing its portability.
Figure 1.Principle of a concave grating miniature spectrometer. (a) A conventional concave grating spectrometer with one entrance slit. (b) The new concave grating spectrometer with two entrance slits. (, , , , , , , and are all located in the meridional plane . is an arbitrary point in the grating).
Figure 1(b) depicts the modifications made in the new setup in which the spectrometer can expand the spectral band without increasing the number of resolution elements of the detector array. First, an additional entrance slit is added to the conventional setup. These two entrance slits, represented by and , share the same concave grating and detector array. Second, the two slits are positioned on different coordinates , such that spectral ranges directed toward the detector array vary between the two slits. The spectral range of of the light raying from slit reaches the detector array, and the spectral range of of the same light raying from slit reaches the same detector array. Third, the geometric theory of aberration is applied to optimize the positions of the two slits, the concave grating, and the detector array such that the two spectral ranges can be connected without a gap. The two slits and are sequentially illuminated and the two spectral ranges can be analyzed separately. The spectral band is successfully enlarged by connecting the two different spectral ranges. For clarity, the two recording points represented by and , which will be referenced in the following section, are not shown in Fig. 1(b). Similarly, , , , , and are all located in the meridional plane .
The first step of the design process is to determine the specific spectral band, spectral resolution, and size of the spectrometer. A spectral range of 400–1200 nm is determined as the spectral band of the proposed miniature spectrometer. This spectral range not only spans the majority of the spectral band of visible light, similar to that of commercial products[21], but also covers a range of the near-infrared spectral band. A spectral resolution of better than 2 nm is decided, which is an acceptable value for many applications[2,3]. The new spectrometer should be placed in a volume of no larger than to ensure portability.
The second step of the design process is to construct a proper optical configuration and to select suitable components for building a prototype spectrometer that can meet the abovementioned requirements. The parameters of the optical configuration include the coordinates of the two recording points, the two entrance slits, and the detector array in the meridional plane . A commercial detector, Sony ILX511B with 2048 total pixels and pixel size of 14 μm, is selected. The size of the two commercial slits is determined to be , and the grating aperture is chosen to be 30 mm in a square shape for an acceptable sensitivity by maintaining a certain amount of power passing through. The radius of the concave grating is set to be 83.68 mm to attain a compact system.
An algorithm based on light-path functions that are thoroughly illustrated in Ref. [20] is employed to calculate the values of these parameters. Optical-path-length function represents the light path raying from entrance slits and ; the light is diffracted at a point located on the th groove of the concave grating, and then directed into a point on the detector can be written by where is the diffraction order of the spectrum, in this study; is the groove number on the concave grating, which is related to the coordinates of the recording points shown in Fig. 1(a) and the wavelength of the recording light source. Diffraction of the lights from slits and following the basic diffraction principle, as well as the relationship between them, can be written as
Given that the two slits share the same concave grating and detector in the new optical configuration, the diffraction of the lights from the two slits have to also meet the following relationship:
A computer program is constructed based on Eqs. (1)–(5) to calculate the initial values of the optical configuration parameters shown in Fig. 1. These values are then input into the well-known optical design software ZEMAX, which further optimizes these values and provides the final parameters.
To illustrate the advantages of the new spectrometer over the conventional one in terms of expanding the spectral band, the optical configuration of a conventional spectrometer is optimized using a similar calculation program and the same hardware but with only one slit. Tables 1 and 2 summarize the optimization results of the two types of spectrometers under the same requirements mentioned at the beginning of this section. The values shown in Table 1 are obtained under the condition that a spectral range of 400–800 nm of the light raying from slit reaches the detector array and a spectral range of 800–1200 nm of the same light raying from slit reaches the same detector array. The values shown in Table 2 are obtained under a spectral range of 400–900 nm. The spectral range distributions of slits and are not only decided by the length of the detector array but also determined for a higher resolution across the spectral band. For the two spectrometers, the values of the groove density are all 350 grooves/mm, which are related to the recording points shown in Fig. 1(a).
Recording Points
rC1 (mm)
78.693
rD1 (mm)
94.980
θC1 (°)
3.550
θD1 (°)
14.500
Optical Path
rA1 (mm)
90.060
θA1 (°)
−5.700
rA2 (mm)
114.339
θA2 (°)
4.710
rH1 (mm)
66.063
θH1 (°)
−27.670
Table 1. Optical Configuration Parameters of the New Spectrometer
The spectral bands and spectral resolutions of these two types of spectrometers are summarized in Fig. 2. The spectral resolution varies across the spectral band, and a fixed relationship does not exist between the wavelength and the spectral resolution. A resolution of better than 1.8 nm is achieved for the new spectrometer over the spectral band of 400–1200 nm. By contrast, the maximum spectral band of the conventional spectrometer is limited to 400–900 nm, across which the spectral resolution can meet the abovementioned requirements. Expansion of the spectral band of the conventional spectrometer worsens the spectral resolution. It can be seen that the spectral resolution changes with wavelength and appears as two concavely curved lines. There are two minimum points located at the wavelengths of around 600 and 1100 nm, respectively. The maximum value of the resolution, about 1.8 nm, appears at the central wavelength of the entire spectral band; that is, around 800 nm. Two main factors causing the resolution’s change with wavelength are inherent light aberration and the use of a plane linear CCD in flat-field concave grating spectrometers. Because of the aberration, the actual imaging positions of the whole spectral band fall on a curved line but not a straight one. The linear CCD is placed to fit the majority of the imaging positions, so the spectral resolution changes with wavelength as Fig. 2 shows.
Figure 2.Simulated spectral bands and spectral resolutions in the whole slit. (a) Spectral resolutions of the two different types of spectrometers in the spectral range of 400–900 nm, and (b) spectral resolution of the new spectrometer in the spectral range of 900–1200 nm.
The spectral resolution was tested to verify the effectiveness of the new design. Figure 3 shows the experimental setup. In the preliminary experiment, an three-axis manual stage, rather than two real entrance slits, is used to set the positions of an entrance slit. The spectrometer size is dominated by the positions of entrance slit , the concave grating, and the detector, which are enclosed by the dashed line in Fig. 3(a); the length and width of the enclosed area are 120 and 70 mm, respectively. The height is decided by the aperture of the concave grating and can be smaller than 40 mm, following the design described in this research. The manual stage will not be used in a real spectrometer. A movable input fiber will be sequentially connected with the two entrance slits that have been adjusted to the designed positions so that the spectrometer can be practically and efficiently operated.
Figure 3.Experimental setup for resolution testing. (a) A fiber is set on the position of entrance slit for testing the spectral band of 400–800 nm. (b) A fiber is set on the position of entrance slit for testing of the spectral band of 800–1200 nm.
A supercontinuum source covering a wavelength range of 450–1100 nm (SuperK SELECT) that is slightly shorter than the spectral band for the design is employed to align the optical components. These components are aligned such that the positions of the components can be fixed when the trends of the measured resolutions are consistent with the simulated values over the entire wavelength range. The trend consistency of the simulated resolution and the measured resolution of the supercontinuum source is defined by the standard deviation of the relative errors of these two resolutions over the spectral range. In this experiment, the optimal condition is obtained with a standard deviation value of no larger than 8%.
After the components are properly placed, strictly evaluated mercury lamps and lasers with a smaller spectral bandwidth are used to test the spectral resolution. Figure 4 shows the spectrum testing results, and a FWHM bandwidth is employed to define the resolution. Table 3 summarizes the experimental and simulated values. The experimental results of the new spectrometer are comparable to the simulated values in corresponding wavelengths, with a maximum error of which is about 9%. However, testing of resolutions in the near-infrared spectrum will be conducted in future studies because near-infrared sources are currently unavailable.
Figure 4.Measured spectra using the structure of two entrance slits. (a) Spectrum of mercury lamp. Spectra of lasers with a central wavelength of (b) 594.00 and (c) 632.80 nm. (d) Spectrum of Argon lamp. (f) Spectrum by using a supercontinuum source.
In conclusion, a new design of a concave grating miniature spectrometer with two entrance slits is theoretically and experimentally illustrated in this Letter. This study demonstrates that a two-entrance slit configuration can expand the spectral band. Simulated results show that the spectral resolution of a two-slit configuration with a spectral band of 400–1200 nm is similar to that of a conventional structure with a spectral band of 400–900 nm. Experimental results using three types of visible light source show that the measured results are consistent with the simulated results, with relative errors of less than 14%. The new design not only retains the advantages of conventional concave grating miniature spectrometers in terms of compactness and simplicity but also effectively expands the spectral band compared with that of the traditional one-slit design. Such enhanced capability in the new miniature spectrometer will benefit spectrometric analysis by providing a wider spectral band, thus allowing for a more effective and convenient way of testing. In future studies, laser sources will be used for spectral resolution testing in the near-infrared spectrum.
Qian Zhou, Jinchao Pang, Xinghui Li, Kai Ni, Rui Tian. Concave grating miniature spectrometer with an expanded spectral band by using two entrance slits[J]. Chinese Optics Letters, 2015, 13(11): 110501