• Photonics Research
  • Vol. 4, Issue 5, 0197 (2016)
Zhengyong Li1, Changrui Liao1,2, Jun Song1, Ying Wang1..., Feng Zhu1, Yiping Wang1,* and Xiaopeng Dong3|Show fewer author(s)
Author Affiliations
  • 1Key Laboratory of Optoelectronic Devices and Systems of Ministry of Education and Guangdong Province, College of Optoelectronic Engineering, Shenzhen University, Shenzhen 518060, China
  • 2e-mail: cliao@szu.edu.cn
  • 3School of Information Science and Engineering, Xiamen University, Xiamen 361005, China
  • show less
    DOI: 10.1364/prj.4.000197 Cite this Article Set citation alerts
    Zhengyong Li, Changrui Liao, Jun Song, Ying Wang, Feng Zhu, Yiping Wang, Xiaopeng Dong, "Ultrasensitive magnetic field sensor based on an in-fiber Mach–Zehnder interferometer with a magnetic fluid component," Photonics Res. 4, 0197 (2016) Copy Citation Text show less
    Schematic diagram of the proposed magnetic field sensor.
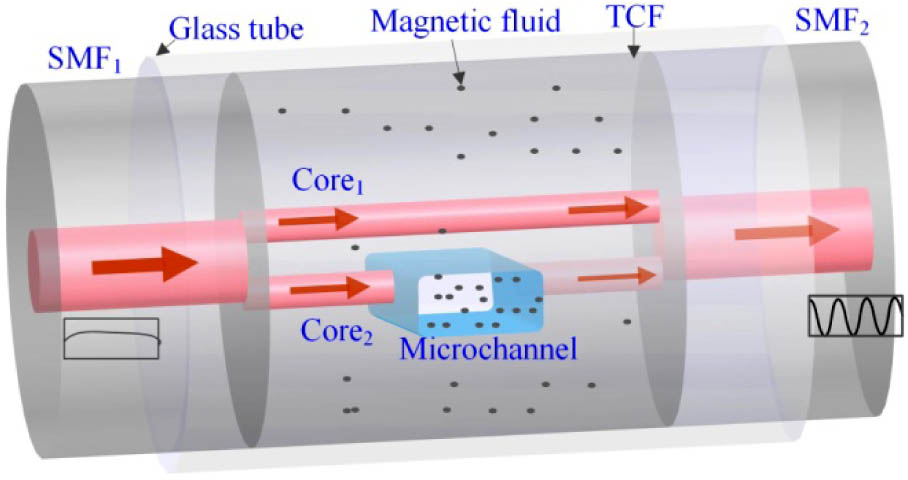
    Fig. 1. Schematic diagram of the proposed magnetic field sensor.
    (a) Optical microscope image of the cross-sectional morphology of SMF and TCF, including the dimensions of the elliptical TCF cores and the splicing point between SMF1 and TCF. (b) Schematic diagram of the femtosecond laser micromachining system. The insert image shows an optical microscope image of the drilled microchannel through Core2.
    Fig. 2. (a) Optical microscope image of the cross-sectional morphology of SMF and TCF, including the dimensions of the elliptical TCF cores and the splicing point between SMF1 and TCF. (b) Schematic diagram of the femtosecond laser micromachining system. The insert image shows an optical microscope image of the drilled microchannel through Core2.
    Transmission spectra of the pristine TCF and TCF with a microchannel filled with either air or an MF.
    Fig. 3. Transmission spectra of the pristine TCF and TCF with a microchannel filled with either air or an MF.
    Schematic diagram of magnetic field response measurement.
    Fig. 4. Schematic diagram of magnetic field response measurement.
    Variation of the fringe dip wavelength with respect to an applied magnetic field, divided into sluggish area, high-sensitive area, low-sensitive area, and saturated area.
    Fig. 5. Variation of the fringe dip wavelength with respect to an applied magnetic field, divided into sluggish area, high-sensitive area, low-sensitive area, and saturated area.
    (a) Transmission spectral evolution with an increasing applied magnetic field in the linear response region from 5 to 9.5 mT. (b) Variation of the fringe dip wavelength and dip intensity with respect to an applied magnetic field.
    Fig. 6. (a) Transmission spectral evolution with an increasing applied magnetic field in the linear response region from 5 to 9.5 mT. (b) Variation of the fringe dip wavelength and dip intensity with respect to an applied magnetic field.
    StructureRange (mT)Wavelength Sensitivity (nm/mT)
    Single-mode–multimode–single-mode [10]0–220.905
    Asymmetric optical fiber taper [16]0–21.4−0.16206
    Taper-like and lateral-offset fusion splicing [9]3.8–47.50.141
    Michelson interferometer [13]0–1070.0649
    Fabry–Perot interferometer [6]0–400.431
    Proposed MZI5–9.520.8
    Table 1. Comparisons of the Proposed TCF-Based MZI with Other Magnetic Field Sensors
    Zhengyong Li, Changrui Liao, Jun Song, Ying Wang, Feng Zhu, Yiping Wang, Xiaopeng Dong, "Ultrasensitive magnetic field sensor based on an in-fiber Mach–Zehnder interferometer with a magnetic fluid component," Photonics Res. 4, 0197 (2016)
    Download Citation