• Chinese Physics B
  • Vol. 29, Issue 8, (2020)
Xin-Qi Li1, Zhi-Lin Li1, Jia-Ji Zhao1, and Xiao-Song Wu1、2、†
Author Affiliations
  • 1State Key Laboratory for Artificial Microstructure and Mesoscopic Physics, Beijing Key Laboratory of Quantum Devices, Peking University, Beijing 0087, China
  • 2Frontiers Science Center for Nano-optoelectronics and Collaborative Innovation Center of Quantum Matter, Beijing 100871, China
  • show less
    DOI: 10.1088/1674-1056/ab9614 Cite this Article
    Xin-Qi Li, Zhi-Lin Li, Jia-Ji Zhao, Xiao-Song Wu. Electrical and thermoelectric study of two-dimensional crystal of NbSe2[J]. Chinese Physics B, 2020, 29(8): Copy Citation Text show less
    Strong enhancement of the Nernst effect in 2D NbSe2. (a) Optical image of a device for probing the Nernst signal. A, B and C, D are the Nernst probes. The scale bar is 10 μm. (b) IH2 dependence of the Nernst voltage at T = 1.47 K and B = 1.5 T. (c) Temperature dependence of the normalized resistance for samples with different thicknesses. (d) Temperature dependence of the sheet resistance and Nernst signal for S5 at B = 0.5 T. The dash line is the temperature dependence of the sheet resistance at B = 0 T. (e) Field dependence of N with different thicknesses at T/Tc = 0.32. (f) Field dependence of N and R at T = 1.4 K.
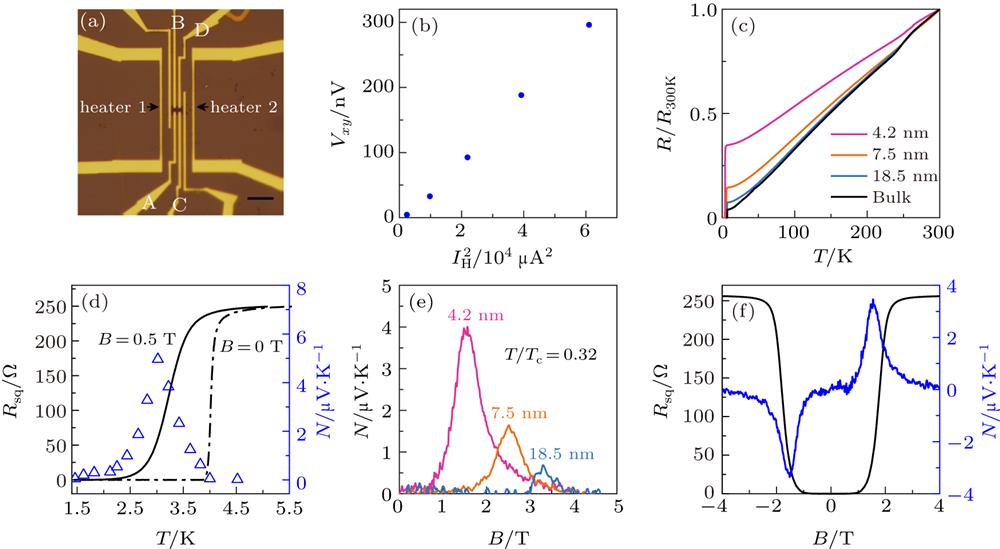
    Fig. 1. Strong enhancement of the Nernst effect in 2D NbSe2. (a) Optical image of a device for probing the Nernst signal. A, B and C, D are the Nernst probes. The scale bar is 10 μm. (b) IH2 dependence of the Nernst voltage at T = 1.47 K and B = 1.5 T. (c) Temperature dependence of the normalized resistance for samples with different thicknesses. (d) Temperature dependence of the sheet resistance and Nernst signal for S5 at B = 0.5 T. The dash line is the temperature dependence of the sheet resistance at B = 0 T. (e) Field dependence of N with different thicknesses at T/Tc = 0.32. (f) Field dependence of N and R at T = 1.4 K.
    Field dependence of (a), (c) the Nernst signal and (b), (d) transport entropy carried by vortices in two samples at different temperatures. Black dots denote the entropy at each temperature when the Nernst signal is at its peak.
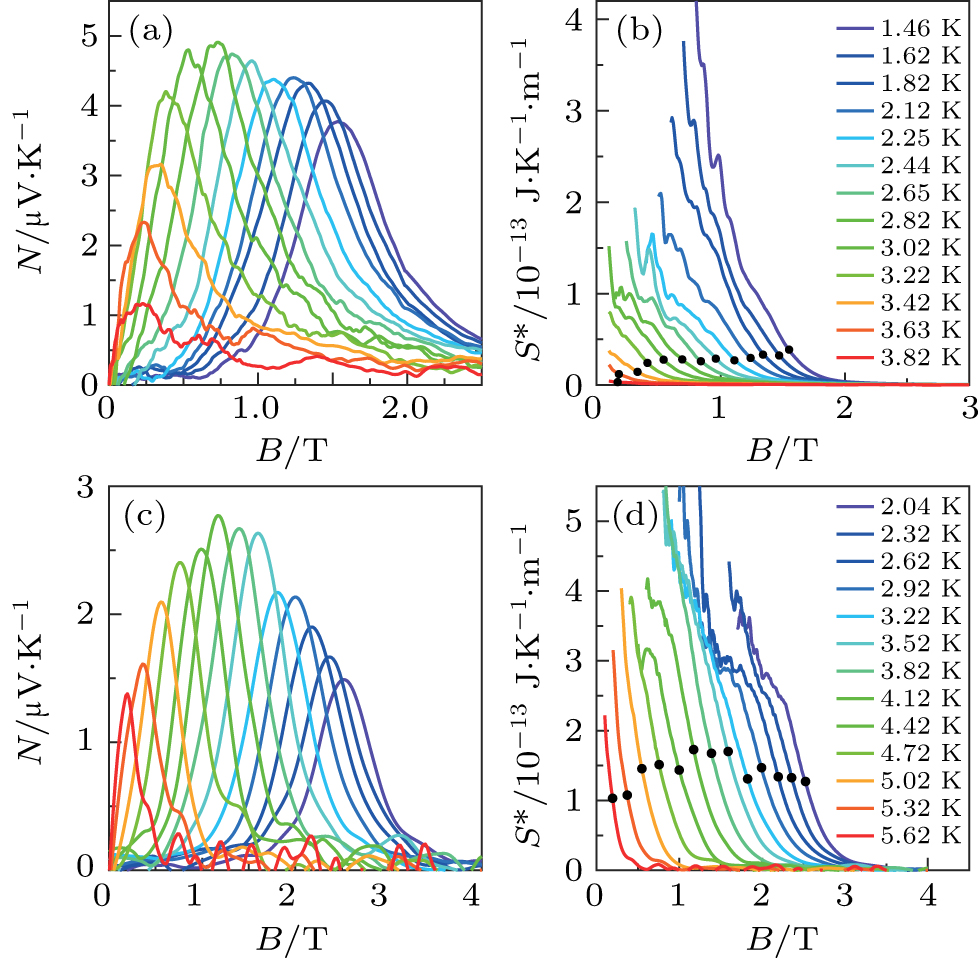
    Fig. 2. Field dependence of (a), (c) the Nernst signal and (b), (d) transport entropy carried by vortices in two samples at different temperatures. Black dots denote the entropy at each temperature when the Nernst signal is at its peak.
    The χ as a function of reduced magnetic field B/Bc2 at different reduced temperatures for S5 (black) and S7 (blue). (a) T/Tc = 0.32, (b) T/Tc = 0.38, (c)T/Tc = 0.53, (d)T/Tc = 0.63, (e) T/Tc = 0.72.
    Fig. 3. The χ as a function of reduced magnetic field B/Bc2 at different reduced temperatures for S5 (black) and S7 (blue). (a) T/Tc = 0.32, (b) T/Tc = 0.38, (c)T/Tc = 0.53, (d)T/Tc = 0.63, (e) T/Tc = 0.72.
    The B–T phase diagrams. (a), (b) Characteristic fields obtained from the resistance and the Nernst signal for samples S5 and S7, respectively. (c) Field dependence of the normalized Nernst signal and resistance in S5 at T/Tc = 0.62, showing a tail above Bc2R. (d) Field dependence of the normalized Nernst signal and resistance in S7 at T/Tc = 0.62, showing no tail above Bc2R. The blue dotted line marks Bc2R.
    Fig. 4. The BT phase diagrams. (a), (b) Characteristic fields obtained from the resistance and the Nernst signal for samples S5 and S7, respectively. (c) Field dependence of the normalized Nernst signal and resistance in S5 at T/Tc = 0.62, showing a tail above Bc2R. (d) Field dependence of the normalized Nernst signal and resistance in S7 at T/Tc = 0.62, showing no tail above Bc2R. The blue dotted line marks Bc2R.
    Magnetic field induced SIT in S5. (a) Magnetoresistance of sample S5 at different temperatures ranging from 1.43 K to 5.03 K. (b) Zoom-in plot of magnetoresistance in (a) near the crossing point. Inset: Rsq as a function of temperature at B = 2.5 T, 2.8 T, and 3.5 T. (c) Normalized resistance R/Rc as a function of the scaling variable t |B – Bc|. (d) ln (T/T0) versus ln t. The red line is a linear fit. The zv value is obtained from the slope of the fit.
    Fig. 5. Magnetic field induced SIT in S5. (a) Magnetoresistance of sample S5 at different temperatures ranging from 1.43 K to 5.03 K. (b) Zoom-in plot of magnetoresistance in (a) near the crossing point. Inset: Rsq as a function of temperature at B = 2.5 T, 2.8 T, and 3.5 T. (c) Normalized resistance R/Rc as a function of the scaling variable t |BBc|. (d) ln (T/T0) versus ln t. The red line is a linear fit. The zv value is obtained from the slope of the fit.
    SampleThicknessρnMean free pathGinzburg–Landau coherence length at 0 Kη/10−8 N⋅s⋅m−2 at T/Tc = 0.32TcRRR
    S54.2 nm110 μΩ⋅cm11.7 nm9.1 nm0.44.18 K2.9
    S77.5 nm7.2 μΩ⋅cm106 nm8.1 nm9.66.13 K7.0
    S9e18.5 nm9.3 μΩ⋅cm110 nm10.86.88 K13.9
    Table 1. Basic information of samples presented in this study.
    Xin-Qi Li, Zhi-Lin Li, Jia-Ji Zhao, Xiao-Song Wu. Electrical and thermoelectric study of two-dimensional crystal of NbSe2[J]. Chinese Physics B, 2020, 29(8):
    Download Citation