
Yue-Ran Shi, Zhuo-Cheng Lu, Jing-Kun Wang, Wei Zhang. Impurity problem of alkaline-earth-like atoms near an orbital Feshbach resonance [J]. Acta Physica Sinica, 2019, 68(4): 040305-1
- Acta Physica Sinica
- Vol. 68, Issue 4, 040305-1 (2019)
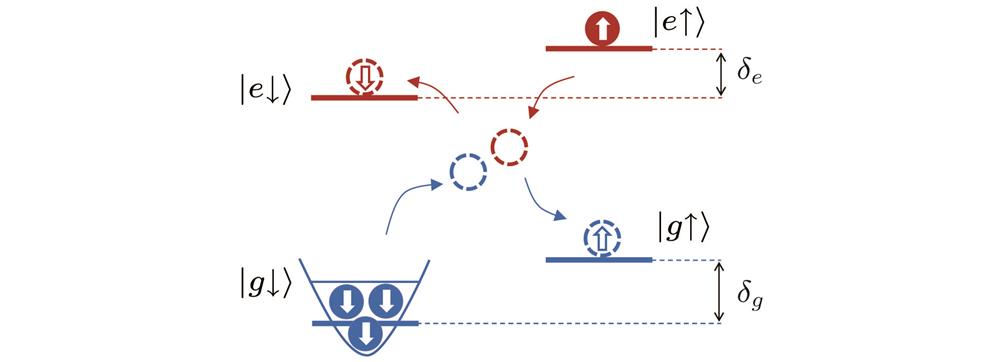
Fig. 1. Level diagram of an OFR. An impurity atom in the
state is immersed in a Fermi gas of alkaline-earth-like atoms in the
state.
and
are the Zeeman shifts of the
and
manifolds, respectively.
类碱土金属原子中的OFR能级图. 杂质原子处于
态, 费米海处于
态. 通过相互作用, 杂质原子和费米海中原子会被散射到闭通道的两个态上.
和
是两个能级的塞曼移动
![(a), (b) The eigenenergy in the molecular state varies with and ; (c) the wave functions' distribution in the open and closed channels; (d) the effective mass for the molecular state whose energy is closed to the threshold energy when . Reproduced from Ref. [23].(a), (b) 分子态的能量随和的变化; (c) 分子态的波函数分布情况; (d) 接近阈值能量的分子态, 在时的有效质量. 引自参考文献[23]](/richHtml/wlxb/2019/68/4/20181937/img_2.jpg)
Fig. 2. (a), (b) The eigenenergy in the molecular state varies with
and
; (c) the wave functions' distribution in the open and closed channels; (d) the effective mass for the molecular state whose energy is closed to the threshold energy when
. Reproduced from Ref. [23].
(a), (b) 分子态的能量随
和
的变化; (c) 分子态的波函数分布情况; (d)
接近阈值能量
的分子态, 在
时的有效质量. 引自参考文献[23]
Fig. 3. (a), (b) The eigenenergy in the attractive polaron state varies with
and
; (c) the wave functions' distribution in the open and closed channels; (d) the effective mass for the attractive polaron state when
. Parameters here are the same as those in Fig. 2 . Reproduced from Ref. [23].
(a), (b) 吸引极化子态的能量随
和
的变化; (c) 吸引极化子态的波函数分布情况; (d) 吸引极化子态在
时的有效质量, 图中发散点为
, 对应于
. 图中参数与图2 中一致. 引自参考文献[23]
Fig. 4. (a), (b) The eigenenergy of the molecule (black solid) and polaron (blue dashed) states vary with
and
. The transition point is around
and
; (c) the transition point
(black solid) and the corresponding energy
(red solid) vary with particle density. Reproduced from Ref. [23].
(a), (b) 分子态(黑色实线)和吸引极化子态(蓝色虚线)的本征能量随
和
的变化, 吸引极化子态到分子态的转变发生在
和
处; (c) 转变点
(黑色实线)和对应的转变能量
(红色实线)随粒子数密度的变化. 引自参考文献[23]
Fig. 5. The spectral function of the polaron state as a function of
and energy for
. The red solid line represents the energy of molecule state, which is given by Eq. (8 ), and the black dashed-dotted line is the energy of attractive polaron state given by Eq. (11 ). The value of the crossing point for these two lines is
. The blue dashed line denotes the repulsive polaron energy given by Eq. (15 ). At large negative
, the branch of repulsive polaron merges into the molecule-hole continuum, which is represented by the broad light yellow area. When
is a positive value, because of the closed channel scattering continuum, the repulsive polaron branch will be blurred. Reproduced from Ref. [30].
极化子态的谱函数
随
和能量变化的彩色图. 图中红色实线表示分子态能量, 由(8 )式计算得到. 黑色点划线为吸引极化子态能量, 由(11 )式计算得到. 两条线相交于
处. 图中蓝色虚线代表排斥极化子能量, 由(15 )式得到. 当
为较大负值时, 排斥极化子与图中由浅黄色区域代表的粒子-空穴连续区域重合. 当
大于零时, 由于存在闭通道散射, 排斥极化子分支会变得模糊. 引自参考文献[30]
Fig. 6. (a), (b) Quasiparticle residues
and effective masses for the attractive (blue dashed) and repulsive (red solid) polarons as functions of
; (c) the decay rate
varies with
. Reproduced from Ref. [65].
(a), (b) 极化子态的准粒子残余和有效质量随
的变化, 其中红色实线对应排斥极化子态, 蓝色虚线对应吸引极化子态; (c) 排斥极化子态的衰变率随
的变化. 引自参考文献[65]
Fig. 7. Level diagram of an OFR, which has two fermi seas. An impurity atom in the
state is immersed in a Fermi gas of alkaline-earth-like atoms in the
and
states.
and
are the Zeeman shifts of the
and
manifolds, respectively.
双费米面情况下, 类碱土金属原子的OFR能级图. 杂质原子处于
态, 费米海处于
态和
态. 通过相互作用, 杂质原子和费米海中原子会被散射到闭通道的两个态上.
和
是两个能级的塞曼移动
Fig. 8. The eigen energies of molecule and attractive polaron states vary with
when
and (a)
, (b)
, (c)
; (d) the transition point
varies with
, where the black solid line represents
and the red dashed-dotted line is the Fermi level
. Reproduced from Ref. [30].
质心动量为零,
((a)),
((b)),
((c))时, 分子态和吸引极化子态的本征能量随
的变化; (d) 吸引极化子态到分子态的转变点随
的变化, 其中, 黑色实线为计算得到的转变点, 红色点划线为费米能级
. 引自参考文献[30]
Fig. 9. The fractions of wave functions for molecule ((a), (c)) and attractive polaron states ((b), (d)) with zero center-of-mass momentum. The parameter in this figure is
for (a) and (b),
for (c) and (d). Reproduced from Ref. [30].
(a), (c) 分子态的波函数分布情况; (b), (d) 吸引极化子态的波函数分布, 此时质心动量为零. (a)和(b)中,
, (c)和(d)中,
. 引自参考文献[30]
Fig. 10. (a), (b) The quasiparticle residue
and the effective mass
vary with
for different values of
. The obvious kink structure when
appears near
. The inset of (a) is the residues for attractive polarons; (c) the decay rates vary with
for different values of
. Reproduced from Ref. [30].
(a), (b) 在
等于不同值时, 排斥极化子态的准粒子残余和有效质量随
的变化情况. 图(a)中的插图描绘了吸引极化子态的准粒子残余随
的变化情况. 图中, 当
时出现的非解析行为发生在
处; (c) 排斥极化子态的衰变率
在
等于不同值时随
的变化情况. 引自参考文献[30]
Fig. 11. The eigen energies of molecule and attractive polaron states vary with
when
in a two-dimensional system and (a)
, (b)
, (c)
; (d) the transition point
varies with
, where the black solid line represents
and the red dashed line is the Fermi level
.
(a)-(c) 二维系统中, 质心动量为零,
((a)),
((b)),
((c))时, 分子态和吸引极化子态的本征能量随
的变化; (d) 吸引极化子态到分子态的转变点随
的变化, 其中黑色实线为计算得到的转变点, 红色虚线为费米能级
Fig. 12. The decay rates of the repulsive polaron state in a a two-dimentional system vary with
for different values of
.
二维系统中
等于不同值时排斥极化子态的衰变率
随
的变化情况


Set citation alerts for the article
Please enter your email address

© Copyright 2018-2021 | Chinese Laser Press. All Rights Reserved 沪ICP备15018463号-20