• Photonics Research
  • Vol. 5, Issue 2, 103 (2017)
Sijun Weng, Li Pei*, Jianshuai Wang, Tigang Ning, and Jing Li
Author Affiliations
  • Key Lab of All Optical Network and Advanced Telecommunication Network of Ministry of Education, Institute of Lightwave Technology, Beijing Jiaotong University, Beijing 100044, China
  • show less
    DOI: 10.1364/PRJ.5.000103 Cite this Article Set citation alerts
    Sijun Weng, Li Pei, Jianshuai Wang, Tigang Ning, Jing Li. High sensitivity D-shaped hole fiber temperature sensor based on surface plasmon resonance with liquid filling[J]. Photonics Research, 2017, 5(2): 103 Copy Citation Text show less
    Cross section of D-shaped hole double-cladding fiber SPR temperature sensor and the proposed setup for loss spectrum interrogation.
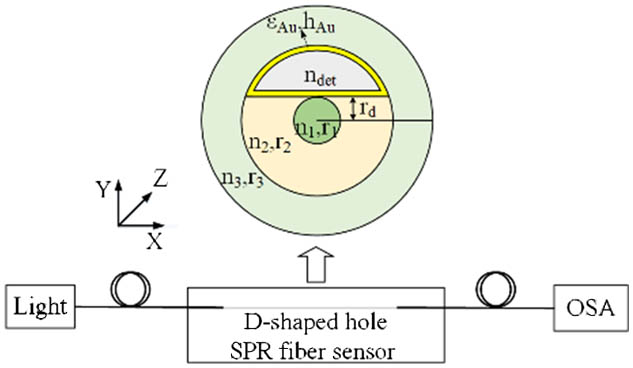
    Fig. 1. Cross section of D-shaped hole double-cladding fiber SPR temperature sensor and the proposed setup for loss spectrum interrogation.
    Electric field distribution (a) of y polarization and (b) of x polarization.
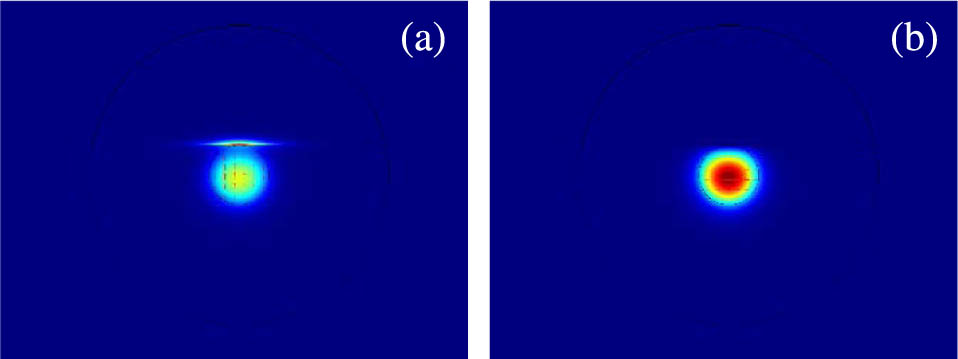
    Fig. 2. Electric field distribution (a) of y polarization and (b) of x polarization.
    Real part of effective refractive index of fiber core mode and SPP mode and the loss spectrum of fiber SPR sensor.
    Fig. 3. Real part of effective refractive index of fiber core mode and SPP mode and the loss spectrum of fiber SPR sensor.
    Influence of rd on the loss spectrum. (a) rd=5 μm, (b) rd=5.5 μm, (c) rd=6 μm, and (d) the fitted results of resonant wavelength of y polarization with different temperatures, where the blue, red, and black markers are the simulation results.
    Fig. 4. Influence of rd on the loss spectrum. (a) rd=5  μm, (b) rd=5.5  μm, (c) rd=6  μm, and (d) the fitted results of resonant wavelength of y polarization with different temperatures, where the blue, red, and black markers are the simulation results.
    Influence of hAu on the loss spectrum. (a) hAu=47 nm, (b) hAu=57 nm, (c) hAu=67 nm, and (d) the fitted results of resonant wavelength of y polarization with different temperatures, where the blue, red, and black markers are the simulation results.
    Fig. 5. Influence of hAu on the loss spectrum. (a) hAu=47  nm, (b) hAu=57  nm, (c) hAu=67  nm, and (d) the fitted results of resonant wavelength of y polarization with different temperatures, where the blue, red, and black markers are the simulation results.
    (a) Loss spectra with different temperatures of y polarization and (b) fitted result of resonant wavelength with different temperatures, where the blue squares are the simulation results and the red line represents the fitted line.
    Fig. 6. (a) Loss spectra with different temperatures of y polarization and (b) fitted result of resonant wavelength with different temperatures, where the blue squares are the simulation results and the red line represents the fitted line.
    Sijun Weng, Li Pei, Jianshuai Wang, Tigang Ning, Jing Li. High sensitivity D-shaped hole fiber temperature sensor based on surface plasmon resonance with liquid filling[J]. Photonics Research, 2017, 5(2): 103
    Download Citation