
Wei SUN, Shaowei LI, Yangjian ZHANG, Gang FU. Effect of Long-term Experimental Warming on the Nutritional Quality of Alpine Meadows in the Northern Tibet[J]. Journal of Resources and Ecology, 2020, 11(5): 516
- Journal of Resources and Ecology
- Vol. 11, Issue 5, 516 (2020)
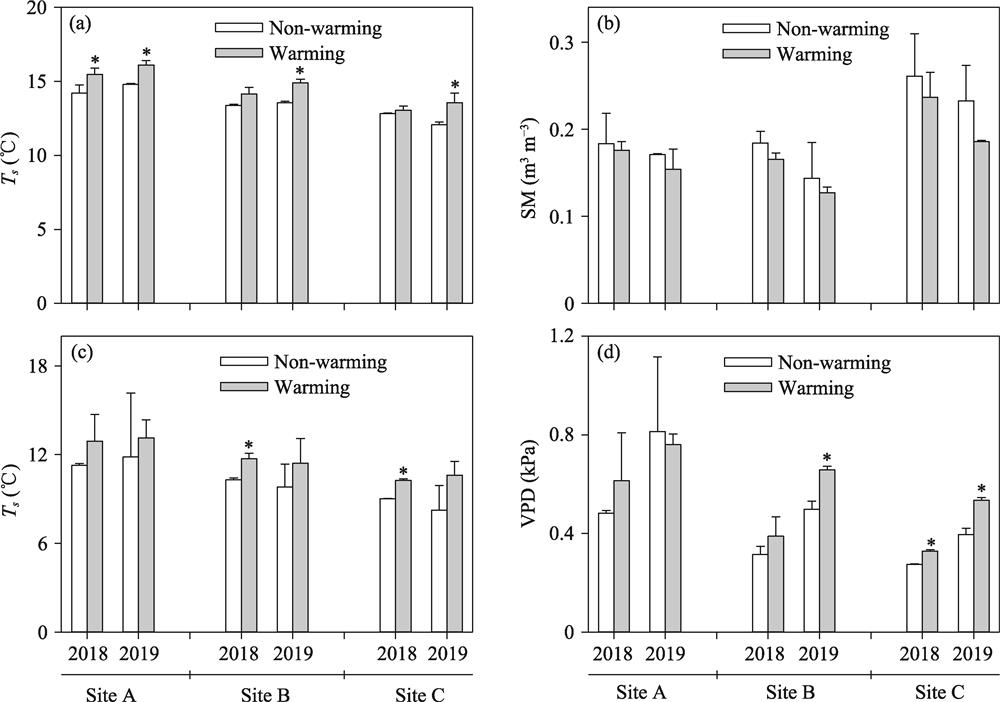
Fig. 1. Fig. 1
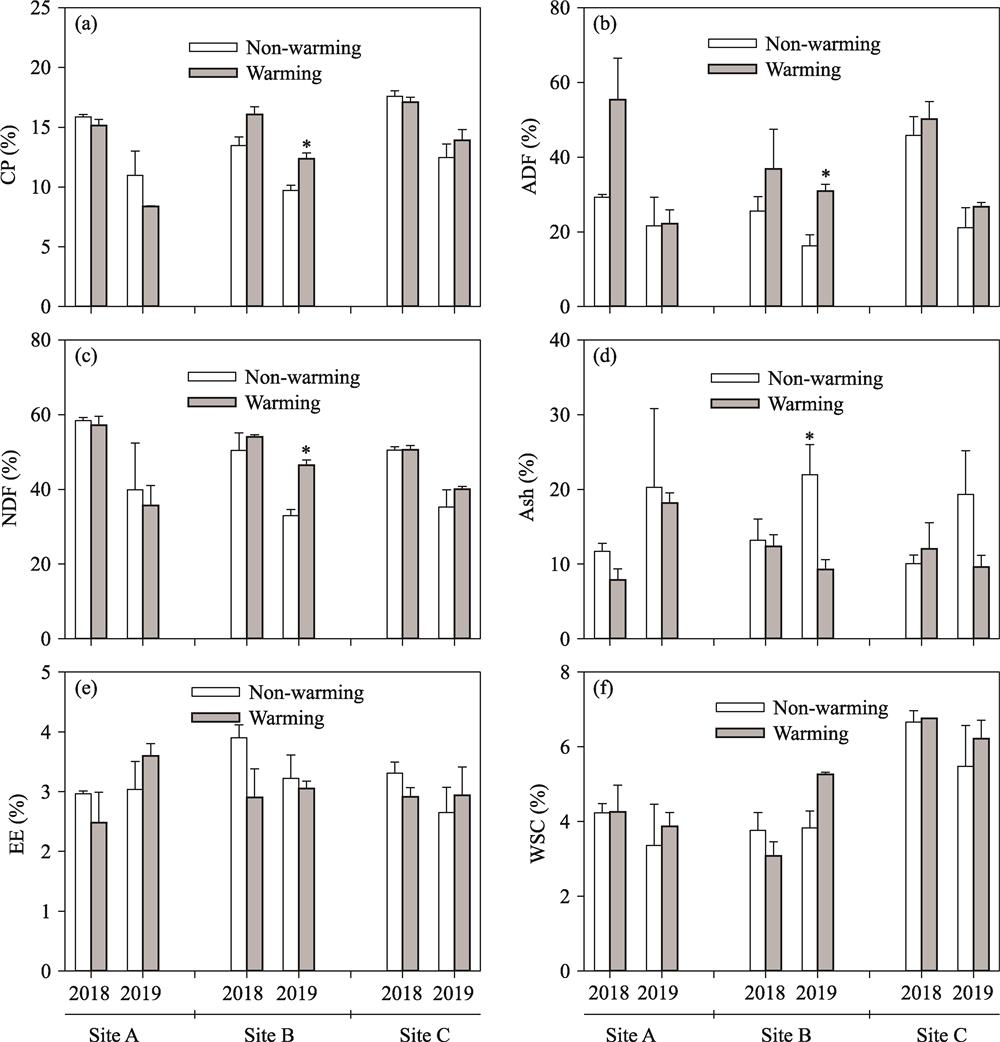
Fig. 2. Fig. 2
Fig. 3. Fig. 3
Fig. 4. Fig. 4
Fig. 5. Fig. 5
|
Table 1.
Annual mean temperature (AT) and precipitation (AP), and growing season (June-September) temperature (GST) and precipitation (GSP) in 1963-2019, 2018 and 2019 in the Damxung County, Lhasa City, Tibet, China
| ||||||||||||||||||||||||||||||||||||||||||||||||||||||||||||||||||||||||||||||||||||||||||||||||||||||||||||
Table 2.
Repeated analysis of variance for the main and interactive effects of experimental warming (W) and measurement year on soil temperature (Ts), soil moisture (SM), air temperature (Ta) and vapor pressure deficit (VPD)
| ||||||||||||||||||||||||||||||||||||||||||||||||||||||||||||||||||||||||||||||||||||||||||||||||||||||||||||||||||||||||||||||||||||||||||||||||||||||||
Table 3.
Repeated analysis of variance for the main and interactive effects of experimental warming (W) and measurement year on the content of crude protein (CP), acid detergent fiber (ADF), neutral detergent fiber (NDF), crude ash (Ash), ether extract (EE) and water-soluble carbohydrate (WSC)
|
Table 4.
The permutational multivariate analysis of variance of experimental warming (W), measurement year (Y) and measurement site (S) on nutritional quality

Set citation alerts for the article
Please enter your email address
© Copyright 2018-2021 | Chinese Laser Press. All Rights Reserved 沪ICP备15018463号-20