• Acta Photonica Sinica
  • Vol. 49, Issue 6, 0604001 (2020)
Qing-yong ZHOU1、2、3, Zi-qing WEI2、3, Kun JIANG4, Si-wei LIU2、3、*, Wei ZHENG5, Yu-feng SHI6, Yi-di WANG5, Yan-ji YANG7, Hui-jun HU6, Dong-dong JIN6, Juan SONG6, Peng-fei SUN8, and Hao-lei SONG2、3
Author Affiliations
  • 1Geographic Spatial Information Institute, Information Engineering University, Zhengzhou 450052, China
  • 2State Key Laboratory of Geo-information Engineering, Xi'an 710054, China
  • 3Xi'an Research Institute of Surveying and Mapping, Xi'an 710054, China
  • 4Beijing Institute of Tracking and Telecommunications Technology, Beijing 100094, China
  • 5College of Aerospace and Material Engineering, National University of Defense Technology, Changsha 410073, China
  • 6Shangdong Aerospace Electro-Technology Institute, Yantai, Shandong 264003, China
  • 7Institute of High Energy Physics, Chinese Academy of Sciences, Beijing 100049, China
  • 8College of Geological Engineering and Surveying, Changan University, Xi'an 710054, China
  • show less
    DOI: 10.3788/gzxb20204906.0604001 Cite this Article
    Qing-yong ZHOU, Zi-qing WEI, Kun JIANG, Si-wei LIU, Wei ZHENG, Yu-feng SHI, Yi-di WANG, Yan-ji YANG, Hui-jun HU, Dong-dong JIN, Juan SONG, Peng-fei SUN, Hao-lei SONG. Research on the Test and Calibration Method of a Focusing X-ray Detector for Pulsar Navigation[J]. Acta Photonica Sinica, 2020, 49(6): 0604001 Copy Citation Text show less
    The relation between loss probability of photon detection and flow rate, time resolution
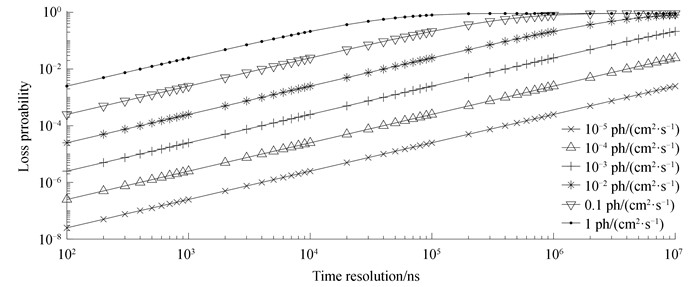
    Fig. 1. The relation between loss probability of photon detection and flow rate, time resolution
    The relationship between pulse similarity and TOA precision
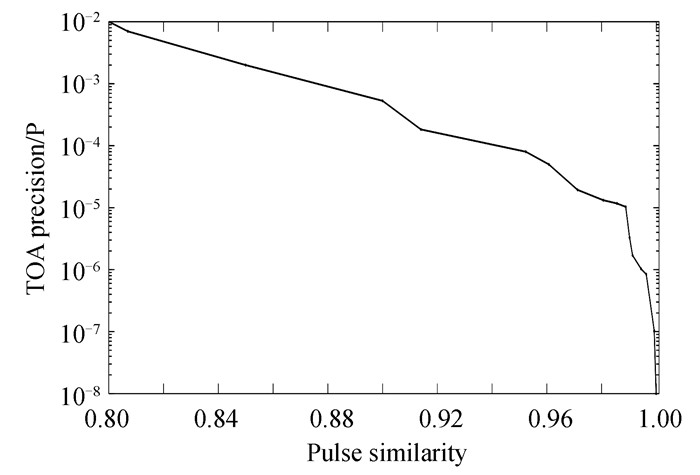
    Fig. 2. The relationship between pulse similarity and TOA precision
    The normalized pulse profile of pulsar in different radiation energy spectrum
    Fig. 3. The normalized pulse profile of pulsar in different radiation energy spectrum
    Working energy region of the focused X-ray detector
    Fig. 4. Working energy region of the focused X-ray detector
    The characteristic energy spectra of six targets observed by focused detector
    Fig. 5. The characteristic energy spectra of six targets observed by focused detector
    The spatial response of X-ray detector
    Fig. 6. The spatial response of X-ray detector
    Distribution of X-ray TOA intervals
    Fig. 7. Distribution of X-ray TOA intervals
    The pulse profile recovery in pulse signal recovery capability test project
    Fig. 8. The pulse profile recovery in pulse signal recovery capability test project
    EnergyEnergy resolutionEfficiency
    Al(1.49 keV)87.79 eV13.36%
    Ti(4.51 keV)128.52 eV39.18%
    Cr(5.41 keV)137.99 eV33.22%
    Fe(6.4 keV)142.39 eV12.08%
    Cu(8.05 keV)154.39 eV2.25%
    Zr(15.77 keV)--
    Table 1. Energy resolution and detection efficiency of focused detector
    Time/sBackground fluxSignal photon flowContour similarityTime/sBackground fluxSignal photon flowContour similarity
    11 000.09010 Crab0.990 02 400.001 Crab10 Crab0.408 0
    999.7410 Crab0.987 62 400.2710 Crab0.408 6
    999.8110 Crab0.991 42 399.3510 Crab0.405 1
    21 600.5601 Crab0.981 21 600.191 Crab1 Crab0.661 6
    1 599.401 Crab0.977 21 599.791 Crab0.671 9
    1 599.841 Crab0.978 31 599.841 Crab0.674 9
    32 402.3200.1 Crab0.770 01 000.001 Crab0.1 Crab0.892 5
    2 393.640.1 Crab0.824 4999.520.1 Crab0.901 8
    2 407.500.1 Crab0.806 2998.890.1 Crab0.907 4
    Table 2. Similarity of the outlines of each group of observed pulses
    Qing-yong ZHOU, Zi-qing WEI, Kun JIANG, Si-wei LIU, Wei ZHENG, Yu-feng SHI, Yi-di WANG, Yan-ji YANG, Hui-jun HU, Dong-dong JIN, Juan SONG, Peng-fei SUN, Hao-lei SONG. Research on the Test and Calibration Method of a Focusing X-ray Detector for Pulsar Navigation[J]. Acta Photonica Sinica, 2020, 49(6): 0604001
    Download Citation