• Journal of Geo-information Science
  • Vol. 22, Issue 4, 877 (2020)
Xinliang XU1、1、*, Jiahao LI1、1、2、2, Zhicheng SHEN1、1、2、2, and Shikuan WANG1、1
Author Affiliations
  • 1State Key Laboratory of Resources and Environmental Information Systems,Institute of Geographic Sciences and Natural Resources Research, Chinese Academy of Sciences, Beijing 100101, China
  • 1中国科学院地理科学与资源研究所 资源与环境信息系统国家重点实验室,北京 100101
  • 2University of Chinese Academy of Sciences, Beijing 100049, China
  • 2中国科学院大学,北京 100049
  • show less
    DOI: 10.12082/dqxxkx.2020.190372 Cite this Article
    Xinliang XU, Jiahao LI, Zhicheng SHEN, Shikuan WANG. Vulnerability of Farmland Ecosystems in Countries Along the "Belt and Road" and Responses to Climate Change[J]. Journal of Geo-information Science, 2020, 22(4): 877 Copy Citation Text show less
    Spatial distribution of farmland in countries along the “Belt and Road” in 2015
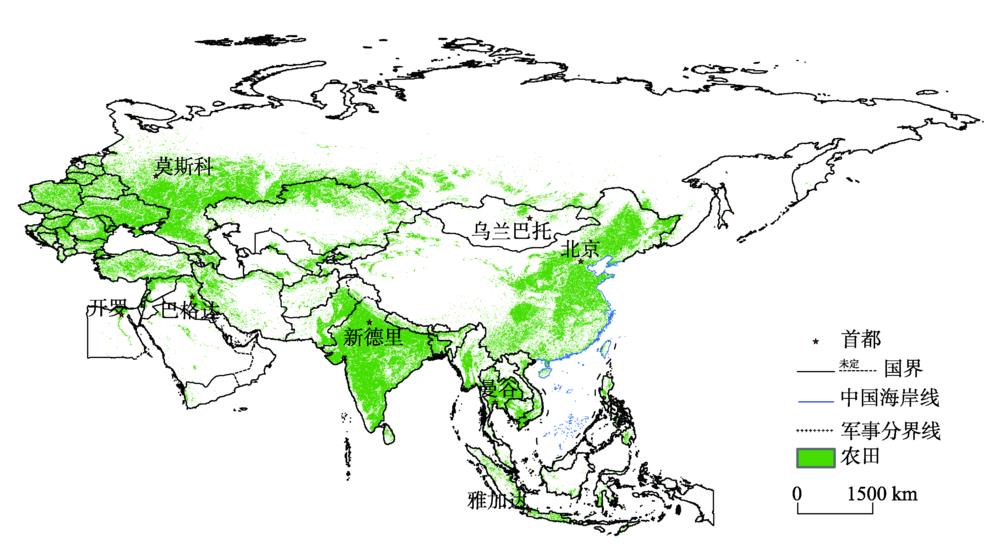
    Fig. 1. Spatial distribution of farmland in countries along the “Belt and Road” in 2015
    Spatial distribution of farmland ecosystem vulnerability in countries along the "Belt and Road" from 2000 to 2015
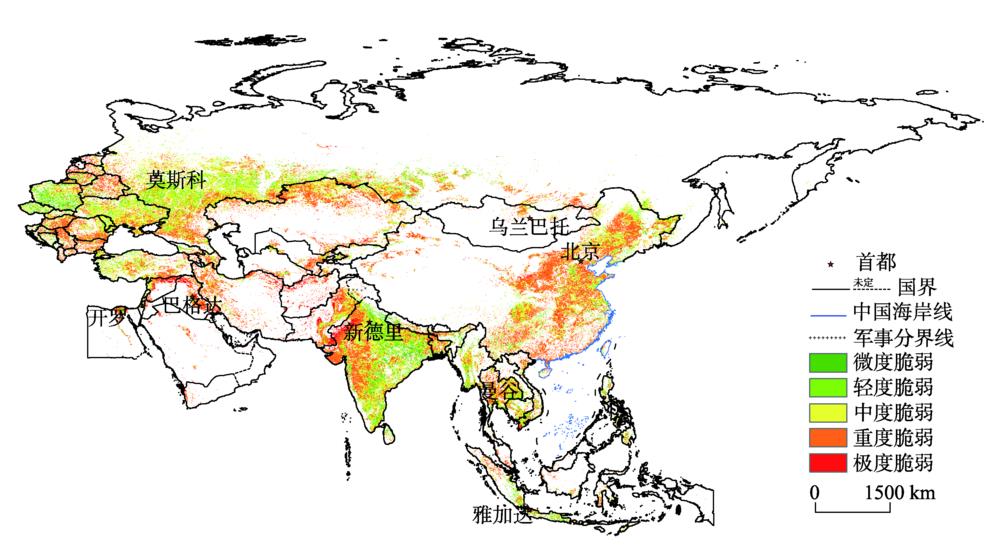
    Fig. 2. Spatial distribution of farmland ecosystem vulnerability in countries along the "Belt and Road" from 2000 to 2015
    Spatial distribution of climate change types in the farmland ecosystems of countries along the "Belt and Road" from 2000 to 2015
    Fig. 3. Spatial distribution of climate change types in the farmland ecosystems of countries along the "Belt and Road" from 2000 to 2015
    Spatial distribution of farmland ecosystem vulnerability in regions of different climate change types along the "Belt and Road" from 2000 to 2015
    Fig. 4. Spatial distribution of farmland ecosystem vulnerability in regions of different climate change types along the "Belt and Road" from 2000 to 2015
    分区微度脆弱轻度脆弱中度脆弱重度脆弱极度脆弱
    全区3.2614.8335.1841.924.81
    俄罗斯2.0619.8548.0628.851.18
    独联体1.8916.3548.5230.402.84
    中东欧6.7719.1837.9232.493.64
    东南亚6.0120.5832.6436.264.51
    南亚6.2419.7832.1534.637.20
    中国1.317.6239.2349.092.75
    蒙古0.115.1634.6858.191.86
    中亚0.404.4432.5857.704.88
    西亚1.238.3028.4245.7216.33
    Table 1. Proportions of farmland area per vulnerability level in countries along the “Belt and Road” from 2000 to 2015 (%)
    区域湿暖干暖湿冷干冷湿
    非显著变化区57.974.9267.7726.1864.0629.233.721.20
    显著变化区37.110.000.006.050.001.790.000.00
    全区95.084.9267.7732.2364.0631.023.721.20
    Table 2. Proportions of farmland ecosystem area per climate change type in countries along the "Belt and Road" from 2000 to 2015 (%)
    气候变化趋势微度脆弱轻度脆弱中度脆弱重度脆弱极度脆弱
    非显著冷干化1.819.7532.4352.583.43
    非显著冷湿化5.2512.5934.0340.617.52
    非显著暖干化2.0013.4236.9042.335.46
    非显著暖湿化5.8517.9132.1840.463.60
    显著暖湿化7.7427.2637.7824.612.61
    Table 3. Proportions of farmland ecosystem area by vulnerability level in regions of different climate change types along the "Belt and Road" from 1980 to 2015 (%)
    Xinliang XU, Jiahao LI, Zhicheng SHEN, Shikuan WANG. Vulnerability of Farmland Ecosystems in Countries Along the "Belt and Road" and Responses to Climate Change[J]. Journal of Geo-information Science, 2020, 22(4): 877
    Download Citation