
Zhihao CHEN, Nanjing ZHAO, Gaofang YIN, Mingjun MA, Ming DONG, Hui HUA, Zhichao DING. A subsection control method of microfluidic automatic sampling in algal cell microscopic imaging[J]. Journal of Atmospheric and Environmental Optics, 2024, 19(1): 38
- Journal of Atmospheric and Environmental Optics
- Vol. 19, Issue 1, 38 (2024)
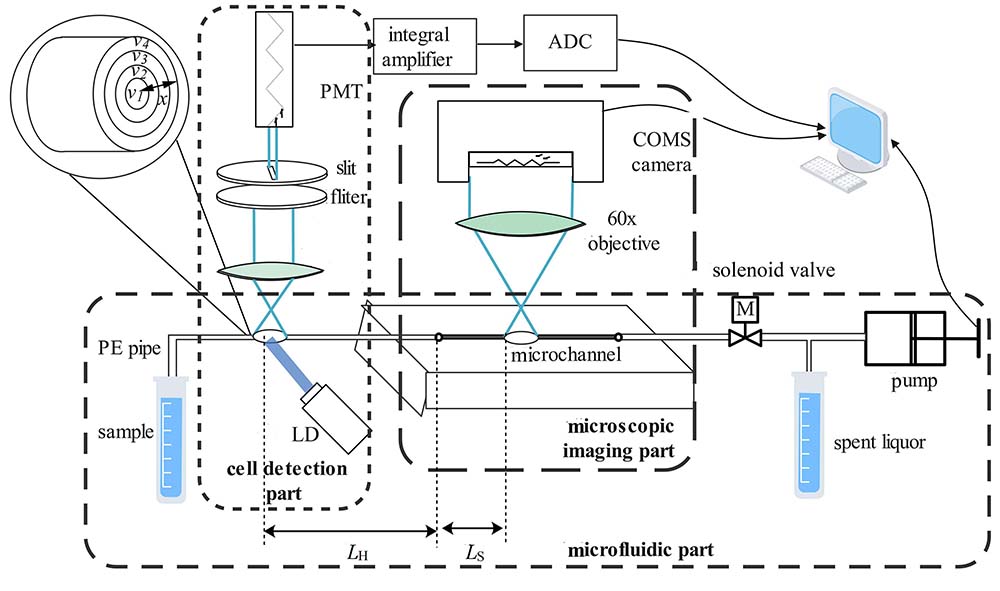
Fig. 1. Schematic diagram of experiment system
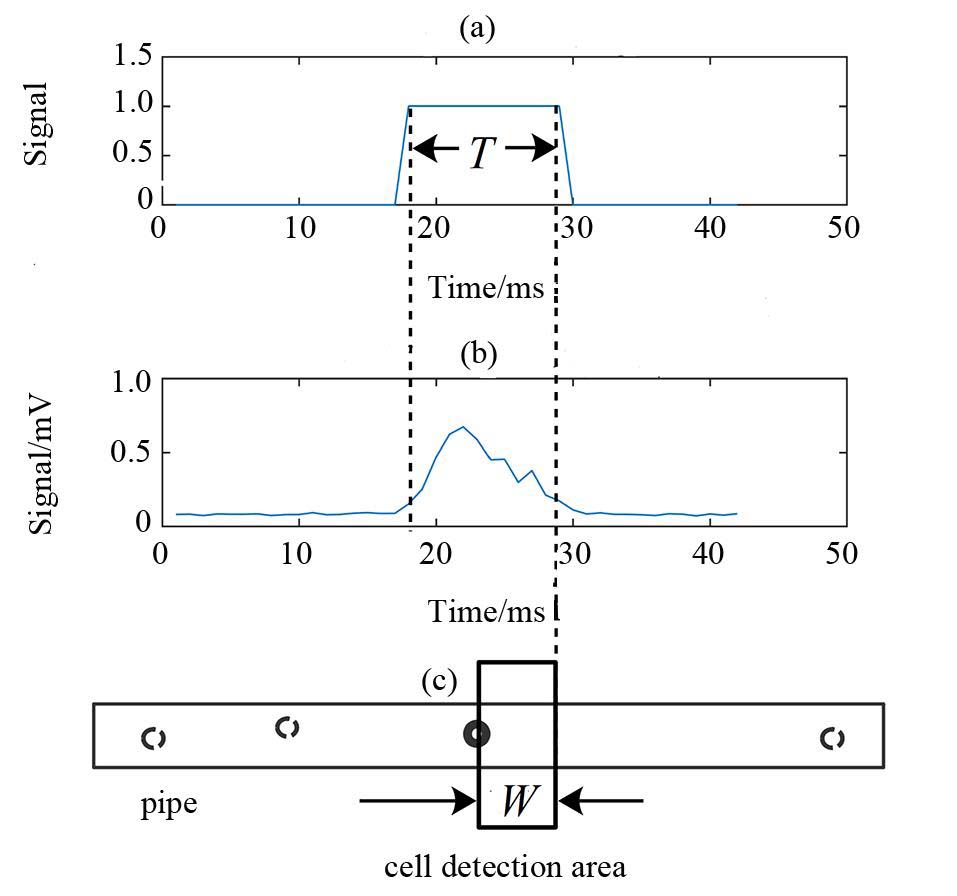
Fig. 2. Schematic diagram of cell detection device. (a) Binarized fluorescence signal; (b) fluorescence signal of algal cell;(c) detection process of algal cell fluorescence
Fig. 3. Schematic diagram of Injection segment control
Fig. 4. Fluorescence signal of single cell
Fig. 5. Probability distribution of particle velocity passing through a section in unit time
Fig. 6. Velocity distribution of algae cells under different volumetric flow rates and fitted curve.(a) 10 μL/min; (b) 20 μL/min; (c) 30 μL/min; (d) 40 μL/min
Fig. 7. Automatic acquisition of algae cell images at different flow rates and microscopy results. (a) 0.24 μL/min;(b) 1.50 μL/min; (c) 6.00 μL/min; (d) images obtained through microscope
|
Table 1. Comparison of sample average flow rate and theoretical rate results
|
Table 2. Comparision of image quality
| |||||||||||||||||||||||||||||||||||||||||||||||||||||||||||||
Table 3. Comparison of injection times between segmented control and slow injection


Set citation alerts for the article
Please enter your email address

© Copyright 2018-2021 | Chinese Laser Press. All Rights Reserved 沪ICP备15018463号-20