
Xiao-Li Zhu, Yao-Gai Hu, Zheng-Yu Zhao, Yuan-Nong Zhang. Comparison between ionospheric disturbances caused by barium and cesium [J]. Acta Physica Sinica, 2020, 69(2): 029401-1
- Acta Physica Sinica
- Vol. 69, Issue 2, 029401-1 (2020)
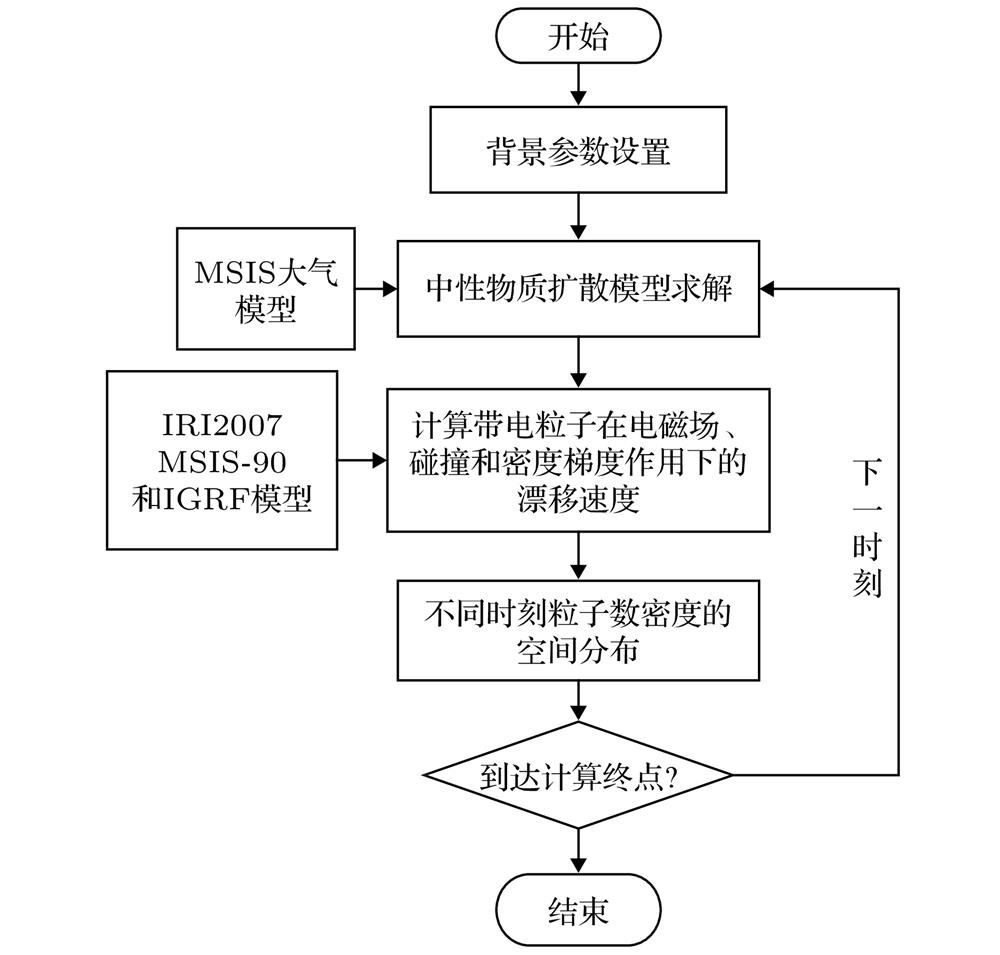
Fig. 1. Flow chart of simulation algorithm.仿真算法流程图
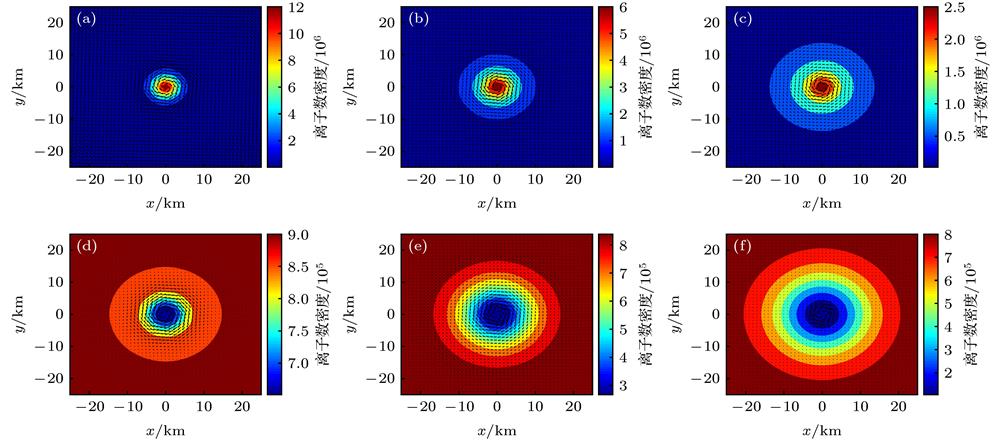
Fig. 2. Density distribution of Ba+ and O+ (in x -y plane) after 10 kg barium released at 300 km while no neutral wind is considered: (a) Ba+, t = 5 s; (b) Ba+, t = 30 s; (c) Ba+, t = 200 s; (d) O+, t = 5 s; (e) O+, t = 30 s; (f) O+, t = 200 s.
无中性风场时, 300 km高度释放10 kg钡后钡离子和氧离子的离子数密度分布(x -y 平面) (a) Ba+, t = 5 s; (b) Ba+, t = 30 s; (c) Ba+, t = 200 s; (d) O+, t = 5 s; (e) O+, t = 30 s; (f) O+, t = 200 s
Fig. 3. Density distribution of Ba+ and O+ (in x -z plane) after 10 kg barium released at 300 km while no neutral wind is considered: (a) O+, t = 5 s; (b) O+, t = 30 s; (c) O+, t = 200 s; (d) Ba+, t = 5 s; (e) Ba+, t = 30 s; (f) Ba+, t = 200 s.
无中性风场时, 300 km高度释放10 kg钡后钡离子和氧离子的粒子数密度分布(x -z 平面) (a) O+, t = 5 s; (b) O+, t = 30 s; (c) O+, t = 200 s; (d) Ba+, t = 5 s; (e) Ba+, t = 30 s; (f) Ba+, t = 200 s
Fig. 4. Density distribution of Ba+ and O+ (in x -z plane) after 10 kg barium released at 300 km with a neutral wind of 1 km/s in the x direction: (a) O+, t = 5 s;(b) O+, t = 30 s; (c) O+, t = 200 s; (d) Ba+, t = 5 s; (e) Ba+, t = 30 s; (f) Ba+, t = 200 s.
存在x 方向大小为1 km/s的中性风时, 300 km高度释放10 kg钡后钡离子和氧离子的粒子数密度分布(x -z 平面) (a) O+, t = 5 s; (b) O+, t = 30 s; (c) O+, t = 200 s; (d) Ba+, t = 5 s; (e) Ba+, t = 30 s; (f) Ba+, t = 200 s
Fig. 5. Three-dimensional density distribution of barium neutral cloud (green sphere) and ion cloud (blue sphere) at 30 s after release钡中性云团(绿色)和离子云团(蓝色)在释放后30 s时的三维分布示意图
Fig. 6. Density distribution of Cs+ and O+ (in x -z plane) after 10 kg cesium released at 300 km with a neutral wind of 1 km/s in the x direction: (a) O+, t = 5 s; (b) O+, t = 30 s; (c) O+, t = 200 s; (d) Cs+, t = 5 s; (e) Cs+, t = 30 s; (f) Cs+, t = 200 s.
存在x 方向大小为1 km/s的中性风时, 300 km高度释放10 kg铯的粒子数密度分布(x -z 平面) (a) O+, t = 5 s; (b) O+, t = 30 s; (c) O+, t = 200 s; (d) Cs+, t = 5 s; (e) Cs+, t = 30 s; (f) Cs+, t = 200 s
Fig. 7. The maximum density of artificial plasma cloud (a) and the maximum disturbance of background oxygen ion (a) versus time.生成的等离子体云团的密度最大值(a)和背景氧离子的最大扰动值(b)随时间的变化
|
Table 1.
The main simulation parameters.
主要仿真参数表


Set citation alerts for the article
Please enter your email address

© Copyright 2018-2021 | Chinese Laser Press. All Rights Reserved 沪ICP备15018463号-20