• Chinese Optics Letters
  • Vol. 14, Issue 4, 040201 (2016)
Baodong Yang1、2、**, Jie Wang1, and Junmin Wang1、*
Author Affiliations
  • 1State Key Laboratory of Quantum Optics and Quantum Optics Devices (Shanxi University), and Institute of Opto-Electronics, Shanxi University, Taiyuan 030006, China
  • 2College of Physics and Electronic Engineering, Shanxi University, Taiyuan 030006, China
  • show less
    DOI: 10.3788/COL201614.040201 Cite this Article Set citation alerts
    Baodong Yang, Jie Wang, Junmin Wang. Two-color cesium magneto-optical trap with a ladder-type atomic system[J]. Chinese Optics Letters, 2016, 14(4): 040201 Copy Citation Text show less
    (a) Schematic diagram of the laser beam arrangement for the two-color Cs MOT. The values of σ± are specified with respect to the positive x-, y-, and z-axes, and I is the electric current of the anti-Helmholtz coils. (b) Simplified diagram of energy levels and related transitions.
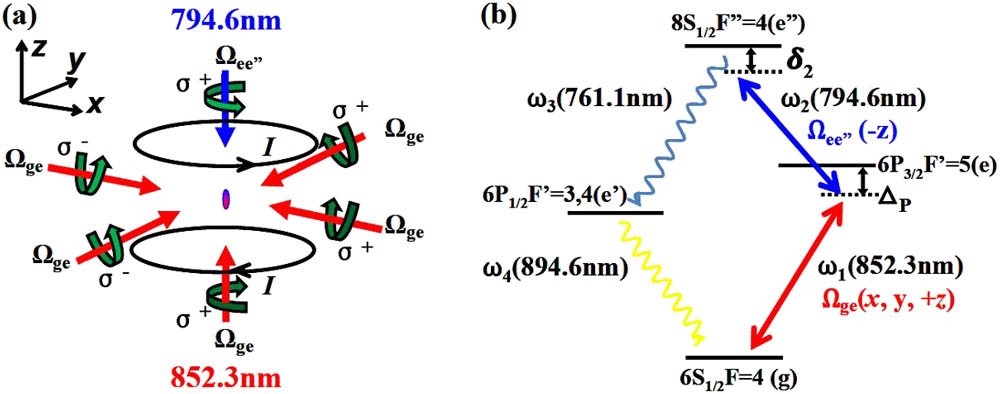
    Fig. 1. (a) Schematic diagram of the laser beam arrangement for the two-color Cs MOT. The values of σ± are specified with respect to the positive x-, y-, and z-axes, and I is the electric current of the anti-Helmholtz coils. (b) Simplified diagram of energy levels and related transitions.
    Peak fluorescence intensity of the trapped atoms versus two-photon frequency detuning δ2 under the condition of (a) ΔP=−10 and (b) −5 MHz. The vertical error bars signify the standard deviation of several measurements, and the horizontal error bars denote the uncertainty of the frequency fluctuation with ∼±1 MHz after laser locking. The inset in (a) gives a typical fluorescence picture of a cold atoms cloud at δ2=−9 MHz by a charge-coupled device camera.
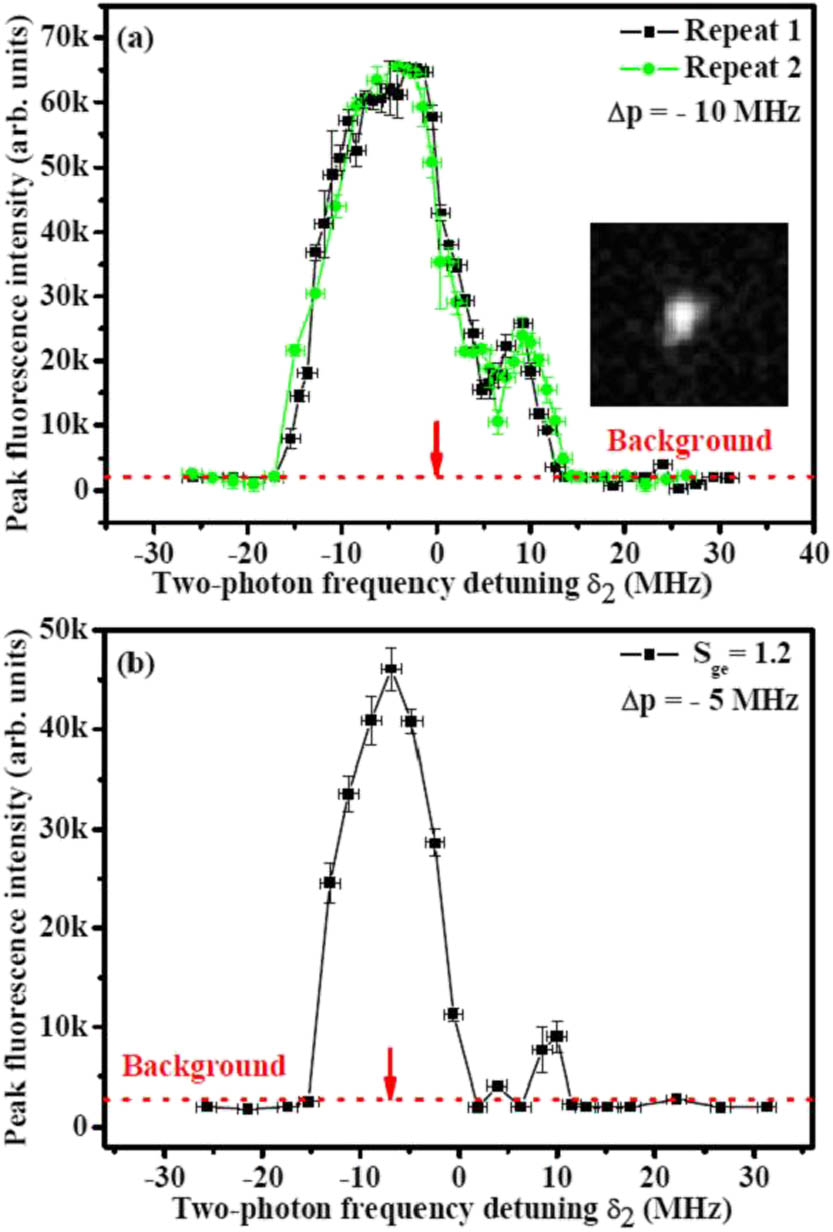
    Fig. 2. Peak fluorescence intensity of the trapped atoms versus two-photon frequency detuning δ2 under the condition of (a) ΔP=10 and (b) 5MHz. The vertical error bars signify the standard deviation of several measurements, and the horizontal error bars denote the uncertainty of the frequency fluctuation with ±1MHz after laser locking. The inset in (a) gives a typical fluorescence picture of a cold atoms cloud at δ2=9MHz by a charge-coupled device camera.
    Peak fluorescence intensity of trapped atoms versus intensity of (a) 852.3 nm cooling laser and (b) repumping laser. The error bars signify the standard deviation of several measurements.
    Fig. 3. Peak fluorescence intensity of trapped atoms versus intensity of (a) 852.3 nm cooling laser and (b) repumping laser. The error bars signify the standard deviation of several measurements.
    Peak fluorescence intensity of trapped atoms versus intensity of 794.6 nm cooling laser for the two-photon detuning (a) δ2=−6.5 and (b) +8.8 MHz. The error bars signify the standard deviation of several measurements.
    Fig. 4. Peak fluorescence intensity of trapped atoms versus intensity of 794.6 nm cooling laser for the two-photon detuning (a) δ2=6.5 and (b) +8.8MHz. The error bars signify the standard deviation of several measurements.
    Baodong Yang, Jie Wang, Junmin Wang. Two-color cesium magneto-optical trap with a ladder-type atomic system[J]. Chinese Optics Letters, 2016, 14(4): 040201
    Download Citation