
Wei Gao, Bo-Yang Wang, Ze-Yu Sun, Lu Gao, Chen-Xue Zhang, Qing-Yan Han, Jun Dong. Tuning upconversion emissions of Ho3+ through changing excitation conditions [J]. Acta Physica Sinica, 2020, 69(3): 034207-1
- Acta Physica Sinica
- Vol. 69, Issue 3, 034207-1 (2020)
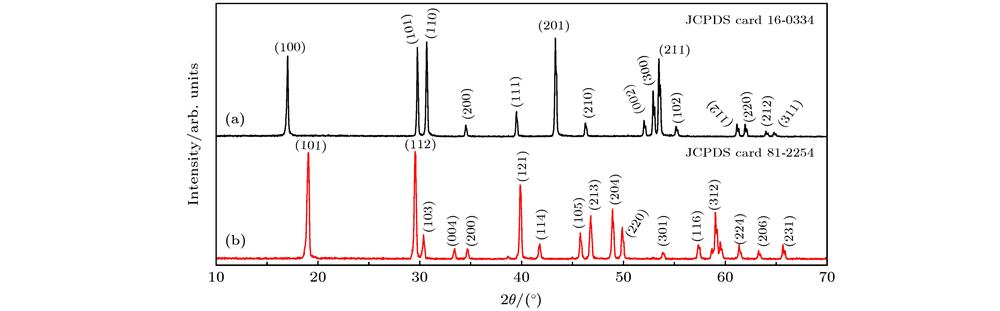
Fig. 1. XRD patterns of (a) NaYF4:20%Yb3+/2%Ho3+ and (b) LiYF4:20%Yb3+/2%Ho3+ microcrystals.
(a) NaYF4:20.0%Yb3+/2.0%Ho3+微米晶体和(b) LiYF4:20.0%Yb3+/2.0%Ho3+微米晶体的XRD图谱
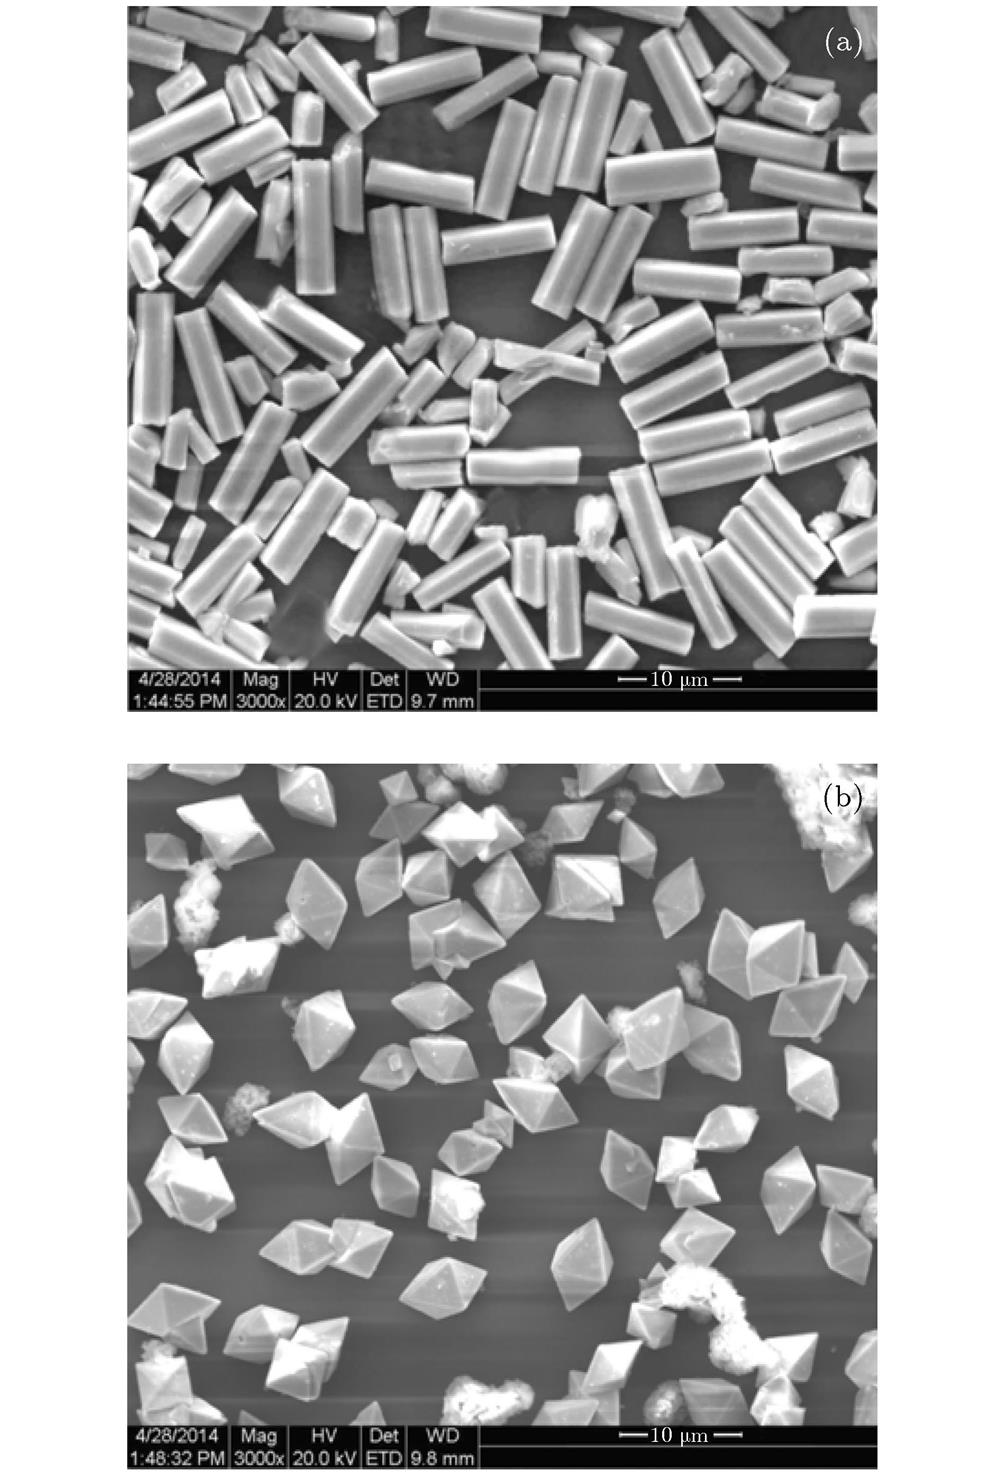
Fig. 2. The SEM images of (a) NaYF4:20%Yb3+/2%Ho3+ and (b) LiYF4:20%Yb3+/2%Ho3+ microcrystals.
(a) NaYF4:20.0%Yb3+/2.0%Ho3+微米晶体和(b) LiYF4:20.0%Yb3+/2.0%Ho3+微米晶体的SEM图谱
Fig. 3. Schematic illustration of confocal microscopy setup.共聚焦显微光谱测试系统示意图
Fig. 4. Upconversion emission spectra and corresponding optical micrographs of single NaYF4:20%Yb3+/2%Ho3+ and LiYF4:20%Yb3+/2%Ho3+ microcrystal under local excitation at 980 nm (100 mW/cm2).
在980 nm激光激发下, 单颗NaYF4:20.0%Yb3+/2.0%Ho3+微米晶体和LiYF4:20.0%Yb3+/2.0%Ho3+微米晶体的上转换发射光谱图(激发功率为100 mW/cm2)
Fig. 5. (a), (b) Upconversion emission spectra and corresponding optical micrographs, (c), (d) the peak area of the green and red emission intensity and corresponding R/G ratio of single NaYF4:20%Yb3+/2%Ho3+ (a), (c) and LiYF4:20%Yb3+/2%Ho3+ (b), (d) microcrystal with excitation power densities increasing from 20 mW to 100 mW.
在980 nm激光激发下, 单颗粒(a) NaYF4:20.0%Yb3+/2.0%Ho3+微米晶体和(b) LiYF4:20.0%Yb3+/2.0%Ho3+微米晶的上转换发射与其激发功率的依赖关系, 插图为其对应光谱图案; (c)和(d)为对应不用激发功率下的峰面积, 插图为其随激发功率变化的红绿比图
Fig. 6. (a), (b) UC emission spectra and corresponding optical micrographs, (c), (d) the peak area of the green and red emission intensity and corresponding R/G ratio of cluster NaYF4:20%Yb3+/2%Ho3+ (a), (c) and LiYF4:20%Yb3+/2%Ho3+ (b), (d) microcrystals with excitation power densities increasing from 20 mW to 100 mW.
在980 nm激光激发下 (a) NaYF4:20.0%Yb3+/2.0%Ho3+微米粉末和(b) LiYF4:20.0%Yb3+/2.0%Ho3+微米粉末的上转换发射与其激发功率的依赖关系, 插图为其对应发光光谱图案; (c)和(d)为对应不用激发功率下的峰面积图, 插图为其随激发功率变化的红绿比图
Fig. 7. Energy level diagrams and proposed energy transfer pathways.Ho3+离子相应的能级图及其可能跃迁机理图
Fig. 8. (a) Downconversion emission spectra and (b) emission mechanism of single NaYF4:20%Yb3+/2%Ho3+ and LiYF4:20%Yb3+/2%Ho3+ microcrystal under laser 532 nm excitation.
在532 nm激发下, 单粒NaYF4:20.0%Yb3+/2.0%Ho3+微米晶体和 LiYF4:20.0%Yb3+/2.0%Ho3+微米晶的下转换发射光谱(a)及相应跃迁机理图(b)

Set citation alerts for the article
Please enter your email address
© Copyright 2018-2021 | Chinese Laser Press. All Rights Reserved 沪ICP备15018463号-20